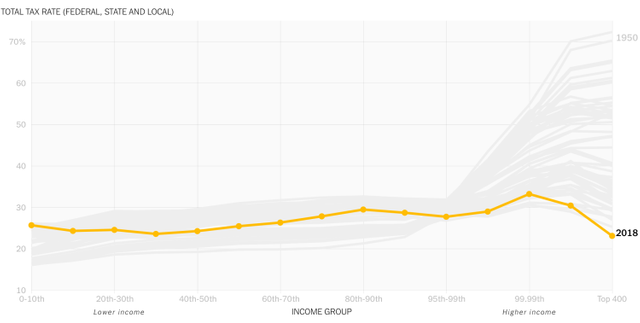
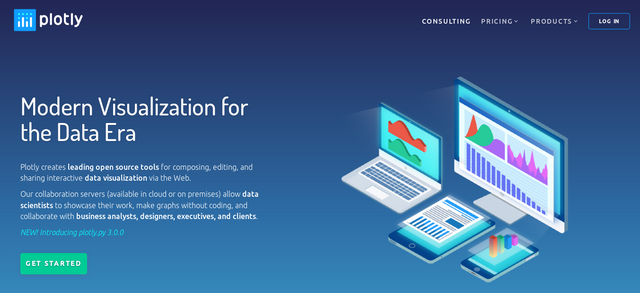
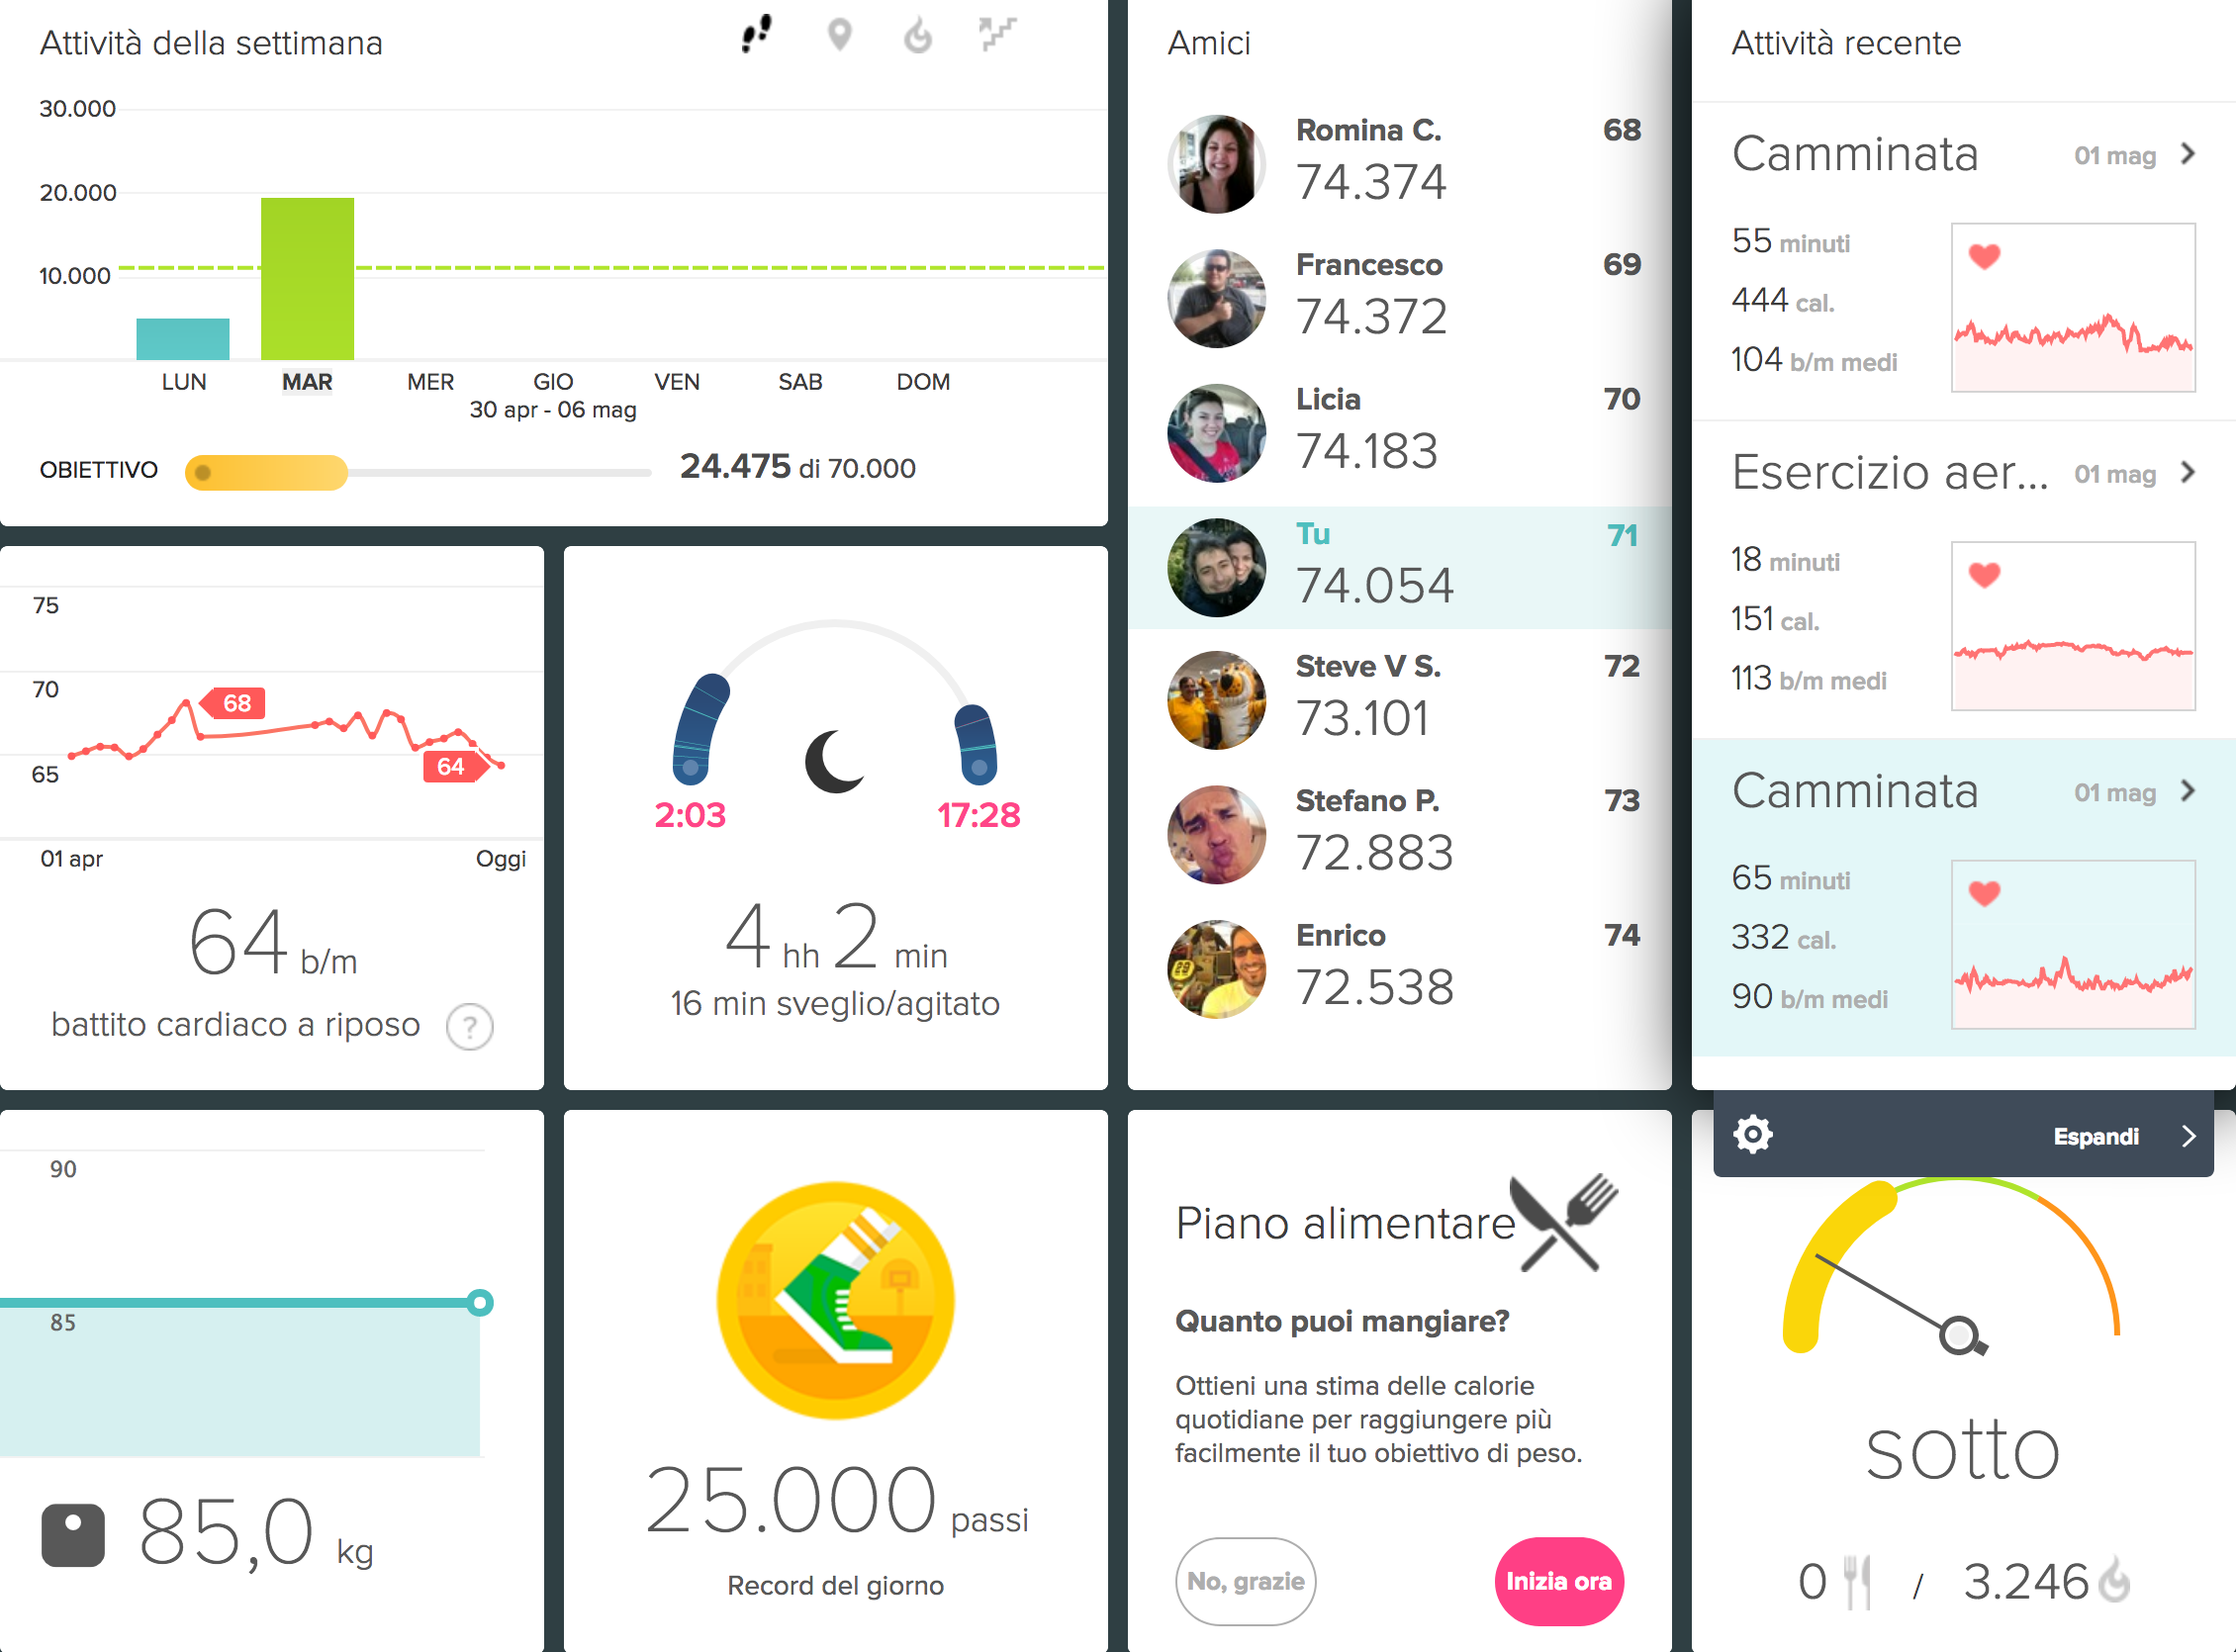
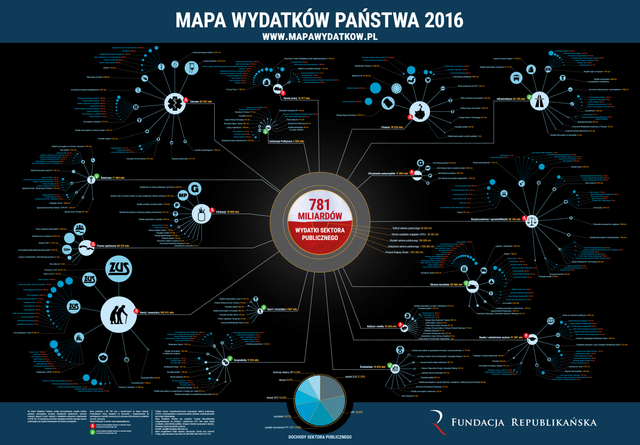
#data-visualizationUnmoderated tagAll postsTrending CommunitiesSteemitCryptoAcademyNewcomers' Communityআমার বাংলা ব্লগKorea • 한국 • KR • KOSteem AllianceSTEEM CN/中文Comunidad LatinaAVLE 일상Steem POD TeamWORLD OF XPILARBeauty of CreativityTron Fan ClubExplore Communities...#data-visualizationTrendingHotNewPayoutsMutedrufusfirefly (61)in #data-visualization • 6 years agoU.S. Tax VisualizationI'm writing about the tax visualization published at . Not only is this an excellent example of data…iqbaladan (65)in #steemhunt • 7 years agoplotly - Visualize Your Data Modernlyplotly Visualize Your Data Modernly Screenshots View Image View Image…whatspal (-3)(1)in #art • 7 years agoArt and TechnologyColor Data VisualizationLeviathan was invited to submit a unique work of art for the Dolby Gallery last March. I…whatspal (-3)(1)in #art • 7 years agoMis-employing radar charts to distinguish multidimensional dataOne alternate approach to this problem is a parallel coordinates chart which is approximately an unrolled version of…whatspal (-3)(1)in #art • 7 years agoData Visualization with Bokeh in Python, Part II: InteractionsMoving beyond static plotsIn the first part of this series, we walked through creating a basic histogram in Bokeh, a…whatspal (-3)(1)in #art • 7 years agoVisualizing Data with Pairs Plots in PythonHow to quickly create a powerful exploratory data analysis visualizationOnce you’ve got yourself a nice cleaned…whatspal (-3)(1)in #art • 7 years agoWhere Does Our Fish Come From?The world of open data is a strangely complex one, as any data scientist will likely testify. It’s a world that I, a…whatspal (-3)(1)in #art • 7 years agoBeautiful, accessible traffic light colorsEveryone uses them: Green, yellow (or orange), and red. We use them in data visualization, we use them in buttons, we…whatspal (-3)(1)in #art • 7 years agoUnsupervised learning demystifiedUnsupervised learning may sound like a fancy way to say “let the kids learn on their own not to touch the hot oven”…datatreemap (53)in #python • 7 years agoIntro to Data Analysis / Visualization with Python, Matplotlib and Pandas | Matplotlib Tutorial!This is a great channel for beginners in data analysis using Python ! These are some of the points the tutorial covers…datatreemap (53)in #data-visualization • 7 years agoA great example of dashboard visualization.There are different ways to visualize data. One of those is certainly the dashboard of the Fitbit application. Here…andrewfact (22)in #technology • 7 years agoGlobal Lifesciences Data Mining and Visualization Market Production, Price, Share, Growth and Forecast Until 2026Data mining applications greatly benefit all firms involved in the lifesciences industry. For example, data mining…flour-man (39)in #data-visualization • 7 years agoPublic Spending by polish government in 2016I'm graphic designer and the easiest way to say something worth for me is making pictures. Especially pictures with…leoford (13)in #technology • 7 years ago7 Key Takeaways from Fact.MR’s Report on Lifesciences Data Mining and Visualization Market for Forecast Period 2017 - 2026The global healthcare data mining & visualization market has been slated to reflect a spectacular rise between the…riyo.s94 (50)in #utopian-io • 7 years agoHow to make chart using ChartistSource If you need a chart library to make data-visualization on your site I'll recommend this chartist.js. This…kimtoma (50)in #public-data • 7 years ago짜증나는 사이트 소개난 문화 사대주의자는 아니지만, 종종 선진국이라 불리는 국가들이 국가적 차원에서 Data와 Design의 힘을 보여줄 때면 감탄하게 될 때가 많다. 특히 내가 전공했고 현재까지 업으로 삼고 있는 Digital…riyo.s94 (50)in #utopian-io • 7 years agoHow to use Chart.jsIn this tutorial I'll show you how to use Chart.js to visualize your data. If you want to visualize data in your site…scipio (65)in #utopian-io • 7 years agoHow-to Do Data Visualization using RAWGraphs - The Scipio Files #3How-to Do Data Visualization using RAWGraphs I've decided to write a tutorial series on Open Source Data…singhpratyush (59)in #elasticsearch • 7 years agoUsing NodeBuilder to instantiate node based Elasticsearch client and Visualizing dataAs elastic.io mentions, Elasticsearch is a distributed, RESTful search and analytics engine capable of solving a…umerbaig (25)in #data-visualization • 8 years agosteemCreated with Sketch.Data Visualization — People remember the feeling not the numbersanalytics belong to every process at your company. Your salesperson is data-driven, your manager is data-driven, your…