How-to Do Data Visualization using RAWGraphs - The Scipio Files #3
How-to Do Data Visualization using RAWGraphs
I've decided to write a tutorial series on Open Source Data Visualization tools, from beginner stuff to pretty complex and advanced. In the past few years, there's been a tremendous development going on regarding Data Visualization tools (it's not just the built-in tools within OpenOffice or Excel anymore people!), and today I'm starting this series with a tutorial about RAWGraphs.
What is RAWGraphs?
As RAW's GitHUB Repository states: "RAW is an open web tool to create custom vector-based visualizations, on top of the amazing d3.js library by Mike Bostock.". And also: "Primarily conceived as a tool for designers and vis geeks, RAW aims at providing a missing link between spreadsheet applications (e.g. Microsoft Excel, Apple Numbers, Google Docs, OpenRefine, …) and vector graphics editors (e.g. Adobe Illustrator, Inkscape, …)."
Hence:
- RAW can be used inside your web browser,
- it lets you create cool data visualizations,
- that are SVGs: Scalable Vector Graphics,
- RAW is built on top of d3.js, a famous JavaScript library for manipulating documents based on data (BTW: d3 is short for Data-Driven Documents, hence the name d3.js). I'll be covering how to build custom Data Visualizations using d3.js in my follow-up tutorials,
- RAW is extremely easy to use, doesn't provide in-depth programming skills (or any programming at all for that matter, if you have the data already),
- you can just insert and edit data in your favorite spreadsheet program (like OpenOffice),
- visualize that data using some easy RAW configurations,
- export and save the data visualizations, either as a PNG image or SVG vector file,
- and further stylize those SVG visualizations in a vector-enabled graphical editor (like InkScape).
How to use RAW?
- first create and save a data file, in JSON or CSV (comma-separated values) format. You could prepare that data by hand, or query and format it from any source (for example the Steem blockchain). I've prepared, for this tutorial, an example CSV file saved as
posts.csvwith the following data:
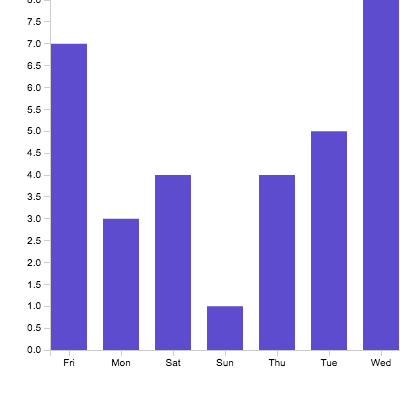
Day,Postcount
Mon,3
Tue,5
Wed,8
Thu,4
Fri,7
Sat,4
Sun,1
- Next, either go to http://app.rawgraphs.io/ or build / install it locally from the RAW GitHub repo. In this tutorial, for simplicity matters, I'm just using http://app.rawgraphs.io/ ,
- Drag-and-drop your own
posts.csvfile, at the 'Load your data' area, or manually type in your own data (structure) in there. If your data structure is valid, a message will show your data was successfully parsed.
- Then, choose a prefab chart type. There are loads of cool chart types to choose from (yet apparently a simple Line Chart seems absent!), and in my example - due to the extremely simple data structure - I will pick and click "Bar chart",
- Next, you need to map your data file to the chart parameters. These depend on the type of chart you have chosen in the previous step. In my "Bar Chart" example, I simply map the "Day"-column to "X Axis" and the "Postcount" to "Height",
- after that, you may want to customize your data visualization, and in this example I change the image dimensions to 400 pixels (width & height), increase the Horizontal Padding (how much space exists between the bars), and pick another (purple / blue) color for the bars in my chart,
- Finally, you can either download the data visualization as a PNG image (primarily intended "As-Is", but of course you could change it with a Photo Editor like Gimp or Photoshop), or SVG (which will be fully customizable via Inkscape or for example Illustrator). My own example end-result is this:
Some conclusions about RAWGraph
Although RAWGraph is extremely beginner-friendly, and therefore a good tool to start your data visualizations endeavors with, it is also somewhat limiting. RAWGraph is built upon D3.js (and other JS libs) for that exact reason: to be beginner-friendly.
However D3.js itself allows for building data visualization tools from scratch, which can be somewhat daunting at first, for it requires (some) knowledge on programming in JavaScript. Apart from building data visualizations, D3.js at the core can also be used as a DOM selector and manipulation engine, like jQuery but faster, and therefore I will continue my "data visualization series" on D3.js, from beginner to advanced!
Stay tuned #BlockchainBI and #Utopian-IO fans! ;-)
Posted on Utopian.io - Rewarding Open Source Contributors
awesome work. I have bookmarked this post for future reference. Also shared to twitter
Wowzers, cool! :-)
And if you think this is awesome, then wait for my D3.js series! (At the beginning it's pretty simple stuff and maybe not rewarding, but what you can accomplish with the more in-depth stuff.... holy macaroni! Stay tuned! ;-)
Definitely looking forward to the D3.js series, and if you have anything on processing.js that would be great as well!
Hi! Well, processing.js is actually a port of Processing (Java), not designed per se as a general purpose HTML drawing library, and animates
<canvas>-elements. D3.js on the other hand animates SVG in native JS!So for now I will focus on D3.js (for data visualization tuts) and later on about GSAP (an extremely fast JS animation lib, which animates about any DOM object including both
canvasandsvg).Interesting, I will have to look into GSAP asap :D Actually, I am more interested in the design rather than the implementation, but it is always good to be aware of the technology involved :)
Then you definitely want D3.js and GSAP.js over Processing.js, because both D3 and GSAP can animate SVG (Scalable Vector Graphics), which you can create / modify using Illustrator / Inkscape.(Say for example you have an .ai file, you can save that as an .svg and vice versa).
You've got a
1UPfrom the @utopian-1up curation trail. 29 Utopians have upvoted your quality contribution to the open source community.Join 1UP for better posts and high curation rewards.1UP is neither organized nor endorsed by Utopian.io!
Thank you 1UP!!!! :-)
Thank you for the contribution. It has been approved.
You can contact us on Discord.
[utopian-moderator]
Thx @umais for the swift review! Bleep! Bleep!
This looks very very cool. I've been looking for something new for my data analyses - this could be just the ticket!
Just the stuff I need too! Awesome stuff @scipio. (credits to @plushzilla for prompting me to look into data vis)
Stay tuned for my D3.js tuts! RAW is built upon it, but using D3.js you can build any chart yourself (not just the data in the graph, but the type and look-n-feel of the graph itself!)
Credit to you for being interested in data vis :D
I think the RAW tech-stack is pretty cool, and the RAW UI is pretty good too, but they could have added a few more "pre-fab" chart types to choose from..
This is nice!
I don't remember who said it xD
That's deep! ;-)
Strange that I couldn't find any references to this quote... because I'd love to know who came up with it :)
I googled it in spanish and it was Rene Descartes, it seems. You might have not find it bc that english translation was made by me hehe
I'd love to give you more than a single upvote for doing that, but now you definitely have my attention :) Expect more in the future! By the way, isn't Yamada a Japanese surname? How many languages do you know?
thank you :D
yes, Yamada is my last name and it is japanese, my grand grand father was from Hiroshima =) he made it to Mexico before 2WW. And I only speak Spanish and English, I tried to learn Japanese, French and Latin but that didn't turn well xD I love languages but there's little time XD
Don't worry, I tried to learn Japanese and Korean as well. In fact there's probably not that many languages I didn't try to have a go at but as you say there is little time. What I am interested is comparative linguistics, or to try and work out the differences between languages. One of my good friend lives in Hiroshima at the moment, and I also have friends with Japanese/Brazilian heritage. It seems like we could have crossed paths a few times on steemit but of all places this was not one that I would have expected :D
Cool! Well, since I couldn't learn them I made a playlist with kpop, jpop, some songs in ukranian also and who knows what else xD but it was in grooveshark and I haven't been able to recover that loss u.u
I think I will give a try to japanese again in case Steem reaches $1000 so I will go there xD
What a bummer that you lost so much good music :( Actually singing karaoke is one of the best ways I know of learning a language :)
wow, great work you are a genius man thanks to shiring @scipio
Great informative post. I learn lots of new thing from this post. Waitting for your next post of this series..thanks for sharing@scipio
https://steemit.com/car/@tjunaidi/review-of-the-advantages-and-disadvantages-mitsubishi-expander-the-latest-998504444b1fd
thanx you so much my friend @scipio for sharining this post.
Hey @scipio I am @utopian-io. I have just upvoted you!
Achievements
Suggestions
Get Noticed!
Community-Driven Witness!
I am the first and only Steem Community-Driven Witness. Participate on Discord. Lets GROW TOGETHER!
Up-vote this comment to grow my power and help Open Source contributions like this one. Want to chat? Join me on Discord https://discord.gg/Pc8HG9x