Using an astronomical calendar to analyze the first solar-cycle of Steemit
ABSTRACT
A calendar is a system of organizing days for social, religious, commercial or administrative purposes. This is done by giving names to periods of time, typically days, weeks, months and years. A date is the designation of a single, specific day within such a system.
Periods in a calendar (such as years and months) are usually, though not necessarily, synchronised with the cycle of the sun or the moon.
This analysis is focused on the effect that the use of a specific calendar has on the statistical results when analyzing a variable in time..
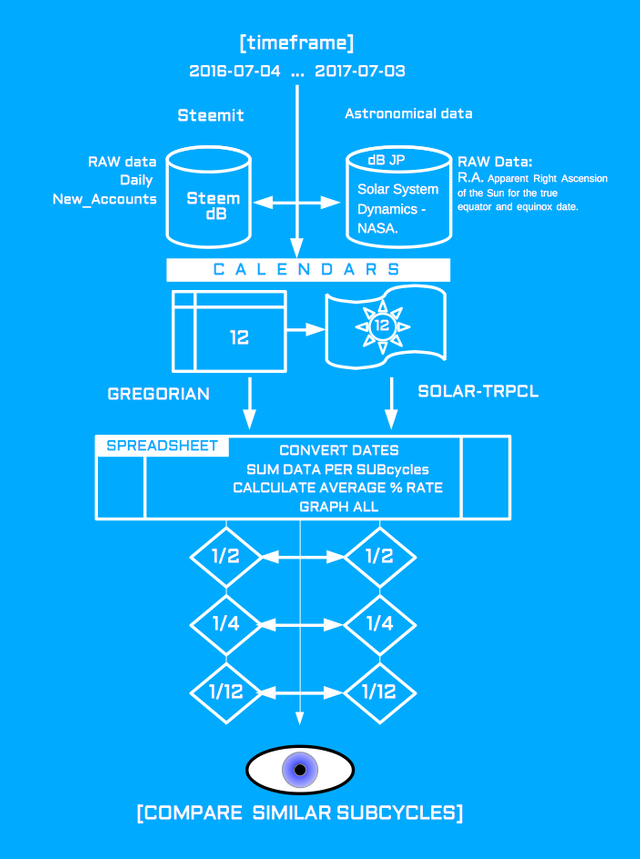
I will use two calendars to analyze the first solar cycle of Steemit since its official launch to compare results.
These two calendars are:
- The Gregorian Calendar.
- The Tropical-Solar Calendar created from astronomical database providing Geocentric Ephemeris for Sun: Apparent Right Ascension of the Sun for the true equator and equinox date.
Ephemeris - A table of values that gives the positions of astronomical objects in the sky over a range of times; the positions of celestial objects (Sun, Moon, planets, etc.) are given in right ascension R.A. (celestial longitude) and declination (celestial latitude);
This analysis includes the following sections:
- I. Visual diagram of the analysis
- II. The first Solar Cycle of Steemit
- III. The Raw and Processed Data
- Steemit data
- Astronomical data
- IV. Calendars and Data analysis
- The Gregorian calendar
- The Solar-Tropical Calendar
- V. How to convert dates between calendars
- VI. Tables and graphs comparation of similar subdivisions
- Absolute values: Number of accumulated new accounts per period
- Average values: Daily Rate of growth of new accounts per period
- VII. Sumary of the Analysis
- VIII. Source of the data
- IX. Analysis Tools
I. Visual diagram of the Analysis

II. The first Solar Cycle of Steemit
Why analyze the first year of existence for Steemit?
To use that analysis as baseline to compare the following years. It is like analyzing the evolution of a being or entity by its chronological age or its own rhythm, on the dates of its anniversaries, even if they do not coincide with the calendar year.
Which is the official date of birth of Steemit?
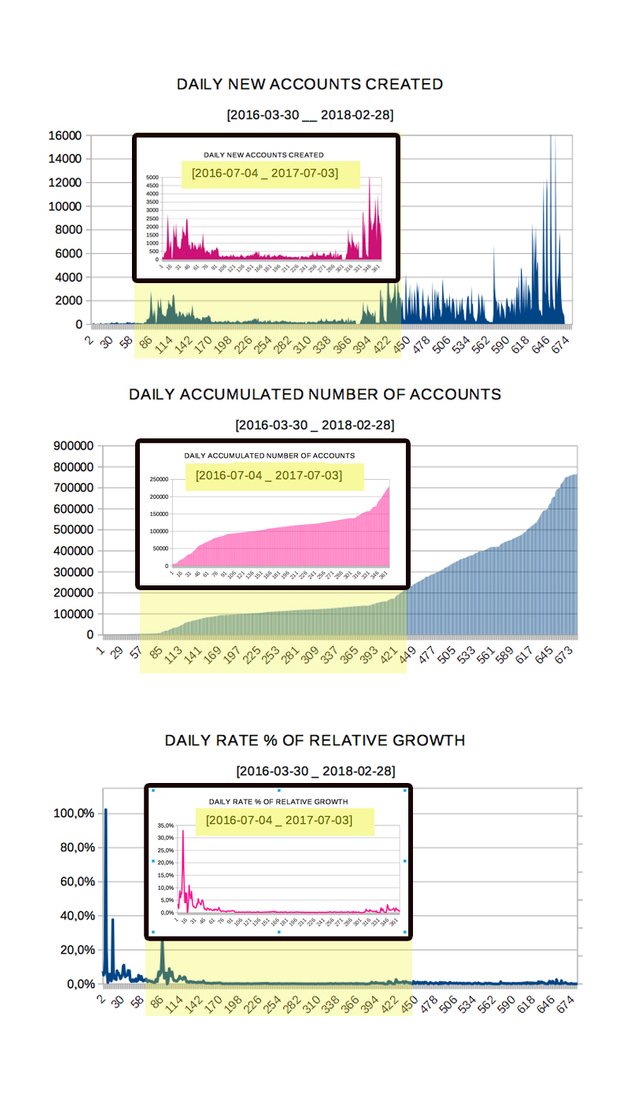
Although the first steemit account was created on 2016-03-30 and a total number of 4,715 accounts were created until the previous day of the analysis period, I have taken the date of the official launch as the start date of the analysis.
I was struck by the interest that there was to be the official launch precisely on July 4th, 2016.
I recommend read July_4th
In May 5th, 2016, Steemit, Inc CEO Ned Scott answered in a interview to Kaherine Fletcher (CoinReport) about the chosen date:
"The Steem blockchain had been pre-coded to issue its first rewards on July 4th, which means it is currently tallying votes and posts, but it won’t reward the best contributions until July 4th. One of our goals is to attract many content creators and voters before July 4th to increase distribution Steem during this important moment." [...] The idea of relating blockchain and freedom and Censorship Free was reinforced by Ned Scott to Mike Dautner (Payment Week) in an article published in July 5th, 2016:

For me, it makes sense to consider the 2016-07-04 as the day of birth of Steemit since the fact of being born happens when a being or entity acquires a certain independence when it is cut the umbilical cord and start breathing on its own.
The previous period from 2016-03-30 until 2016-07-03 can be seen as a period of gestation or pregnancy prior to the birth of Steemit.

III. The Raw and Processed Data
RAW DATA::
New accounts daily created
PROCESSED DATA::
Accumulated number of accounts / Percentage of growth with respect to the accumulated value of the previous day
Note:
In numerous analyzes on the growth of Steemit the variable of new accounts created and also the number of posts, comments, up votes and payouts are shown together. However, I believe that they are two types of growth of different natures. Compared to the growth of a biological ecosystem, the growth in new accounts could be considered as growth in extension in new territories and the growth of post, votes, up votes and payouts would be related to the growth of activity within Steemit. So, here I focus on the first case, leaving for other analysis the rest of the variables.

IV. Calendars and Data Analysis
Using a calendar to analyze data simply consists of grouping the data in different time periods. For example years, months, weeks, etc.
Choosing a calendar implies affecting the data since it affects the sizes or lengths of the time periods to be compared. These effects may be greater or lesser depending on the calendar chosen to perform the statistics.
Two fundamental problems when using a calendar to analyze data:
Different lengths or sizes of the periods of time. To compare accumulated or integrated values of different periods they should accumulate the same number of samples, otherwise the values are not comparable without taking into account that circumstance.
Offset. The start date of the data does not coincide with the beginning of the periods of the calendar. The end date of the data does not coincide with the end of the time period.

The Gregorian calendar
The fundamental unit of time is 1 day of 24 hours and consists of weeks (7), months (28-31), quarters (90/92), semesters (181-184) and year (365-366). The diversity of the lengths of the time periods is clearly seen when examining that the 12 months have a very different number of days from 28 to 31. This also affects the quarters, semesters and year that as everyone knows can be 365 or 366 days.
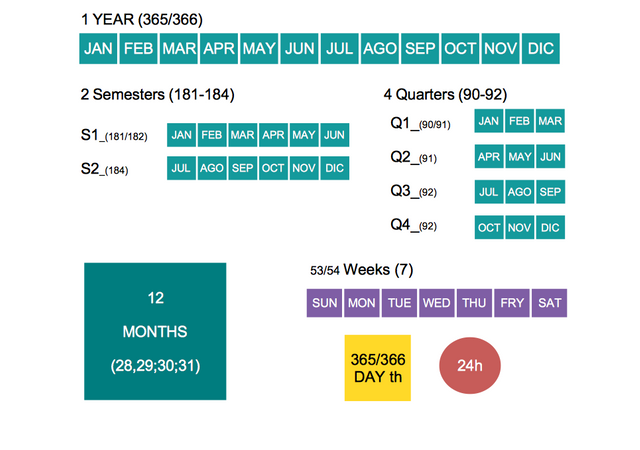
- The example of FEBRUARY: When we obtain accumulation of daily values for MARCH to compare with the accumulated value for FEBRUARY we are ignoring that February has a 9.67% (3 days) less time accumulated.

The Solar-Tropical Calendar
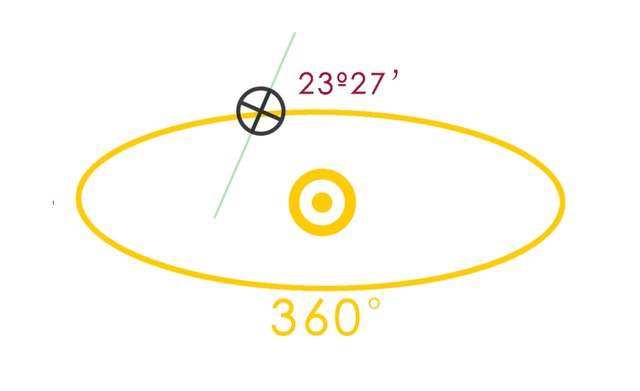
The fundamental unit is the circle or 360 degrees that is associated with the apparent angular revolution of the Sun over a period of rotation of the Earth. What we usually call a year. But not an imprecise 365/366 days year, but an accurate 360º degrees year!
The Solar System
The Tropics
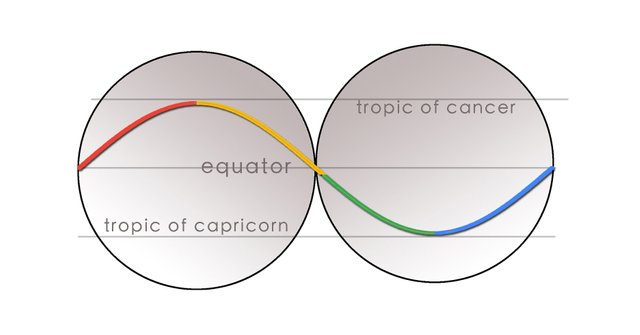
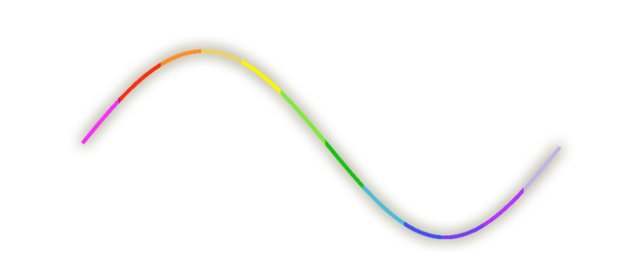
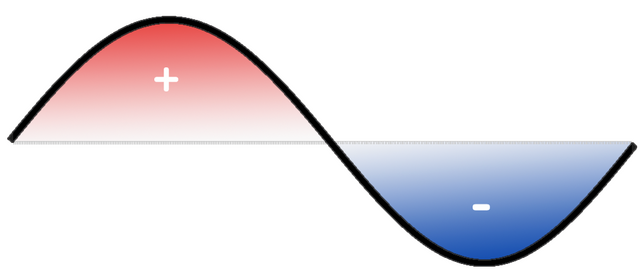
From the point of view of the earth, this movement over a year, created by the translation movement of the earth around the sun through an arc of 360º and with an inclination of the axis of our planet of 23º 27´ relative to the ecliptic plane, can be seen as one cycle of a sinusoidal wave.
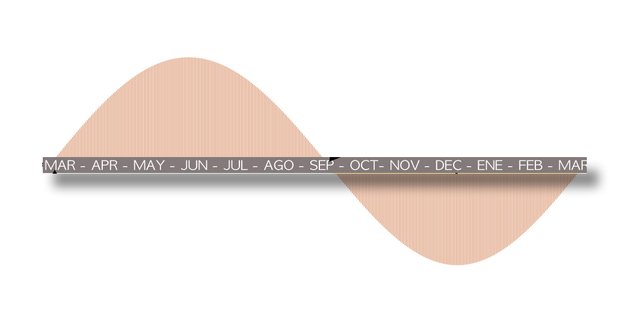
In order to create the time subdivisions for the Solar-Tropical Calendar, the complete 360º cycle is divided into 12 sectors or arcs of 30 degrees each. The relationship with the 12 months and 28/31 days of a month is observed.
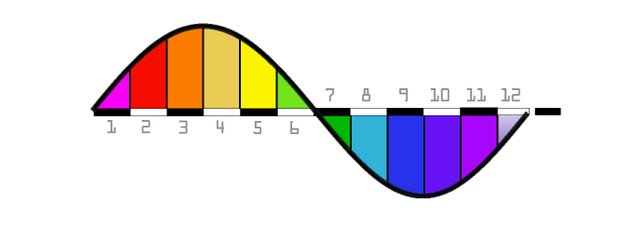
So, in the Solar-Tropical calendar all the periods (sector or arc) have the same size of 30 degrees.
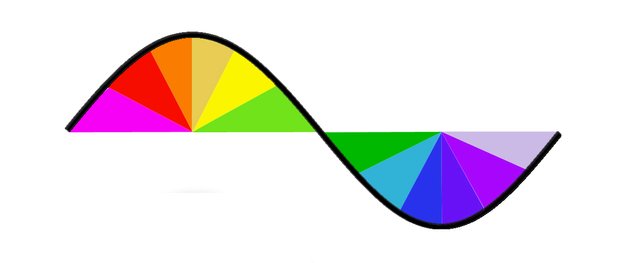
The Sun goes through the 360 degree circle sequentially through the 12 sectors or arcs that can be labeled in many ways.
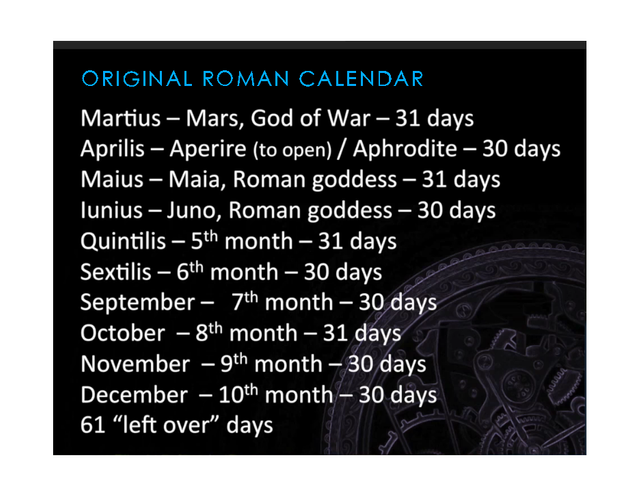
- It is very clarifying to know that the Gregorian calendar is based on the Original Roman Calendar and how the months were distributed in one year

Equivalency Table by labels
| ARC# | ANGLES | ROMAN NUM. | MUSICAL NOTES |
|---|---|---|---|
| 1 | [0º-30º[ | I | DO |
| 2 | [30º-60º[ | II | DO# |
| 3 | [60º-90º[ | III | RE |
| 4 | [90º-120º[ | IV | RE# |
| 5 | [120º-150º[ | V | MI |
| 6 | [150º-180º[ | VI | FA |
| 7 | [180º-210º[ | VII | FA# |
| 8 | [210º-240º[ | VIII | SOL |
| 9 | [240º-270º[ | IX | SOL# |
| 10 | [270º-300º[ | X | LA |
| 11 | [300º-330º[ | XI | LA# |
| 12 | [330º-360º[ | XII | SI |

You can also group the sectors or arcs as well as the months to obtain groups of 4 arcs giving rise to the seasons not usually used to make data analysis.
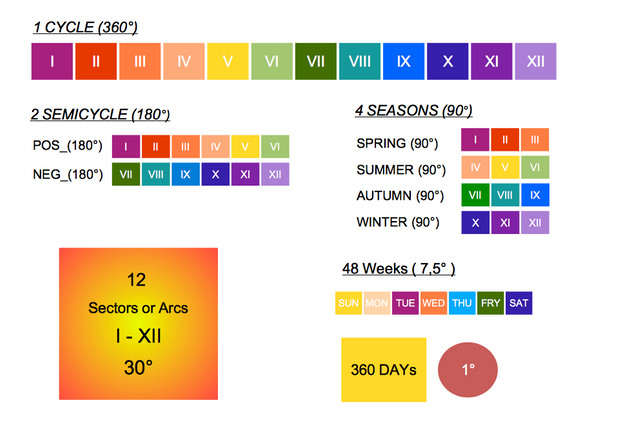
Artificially subdivisions can also be made to obtain 48 pseudo-weeks of 7.5 degrees and 360 pseudo-days of 1 degree. In the past, perhaps due to the lack of precision to determine the solar angle for these values, a lunar calendar was used instead.

V. How to convert dates between calendars
It is necessary a conversion task between the Gregorian calendar and the Natural calendar to place any day of the Gregorian calendar in the natural calendar.
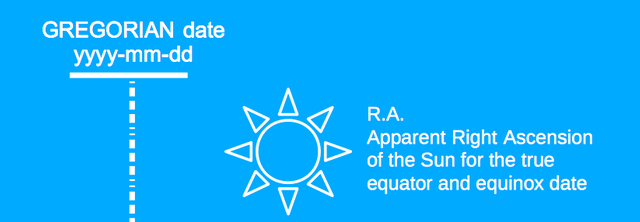
This task would represent an arduous work if it were not done automatically with a spreadsheet with the appropriate formulas. For this I have created a custom spreadsheet to do it.
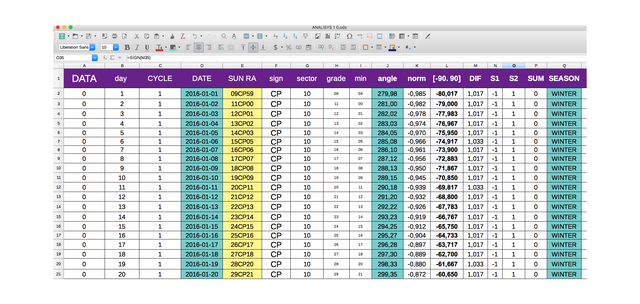

The natural calendar can be segmented and grouped using the Apparent Right Ascension of the Sun for the true equator and equinox of date (hours, minutes, seconds) given by astronomical data bases.

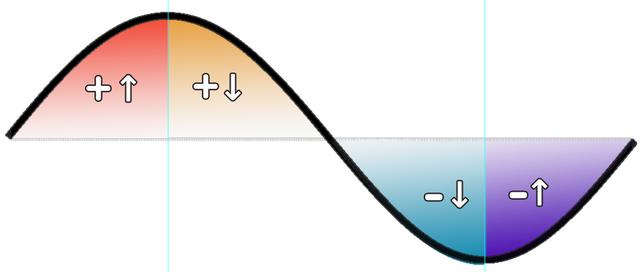
These data, conveniently processed, allow obtaining the rhythm of the Sun that results in a sinusoidal wave. The values, positive or negative, and the signs of its derivatives or gradients, allow to classify each day and place it in different groups in the Solar-Tropical calendar.

VI. Tables and graphs comparation of similar subdivisions
Now I present a comparison of the values obtained for the accumulated number of accounts and for the average daily growth ratio grouped in the different periods of time for the two calendars that have a similar meaning mainly due to their length as MONTHS-SECTORS, QUARTERS-SEASONS y SEMESTER-SEMICYLE, YEAR-CYCLE
| GREGORIAN CALENDAR | NATURAL CALENDAR |
|---|---|
| Year (365-366 days) | Cycle (360°) |
| Semester (181-184 days) | Semi-cycle (180°) |
| Quarter (90 - 92 days) | Season (90°) |
| Month (28 - 31 days) | Sector or Arc (30°) |
FOR ABSOLUTE VALUES OF ACCUMULATED
NUMBER OF ACCOUNTS
Important note.
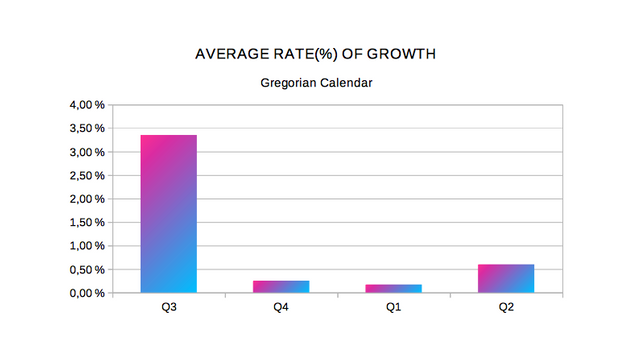
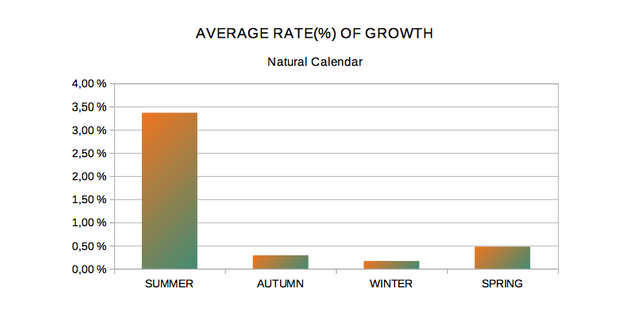
The usual sequence of semesters, quarters and months (and similar periods in the natural calendar) is modified in the graphs to coincide with the real time direction . This is because the start of the analysis period begins on July 4th, 2016.
Year - Cycle
As is logical, the total number of accounts match in the two calendars. This has allowed me to check that the processing is correct.


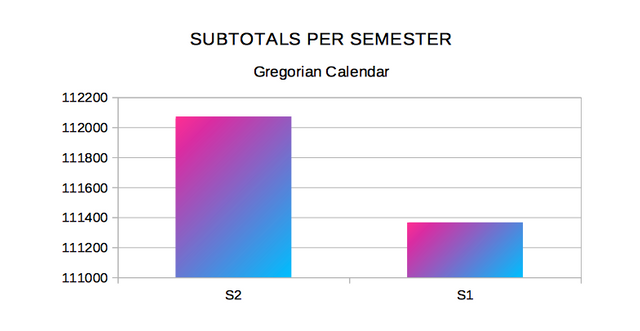
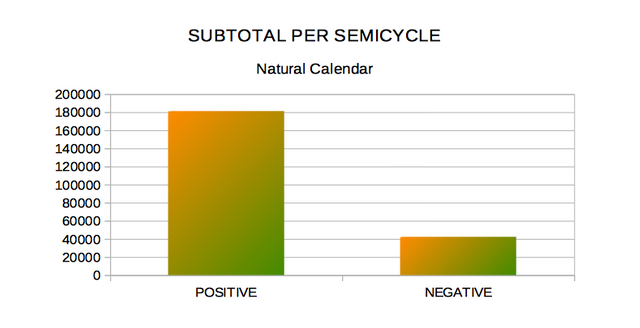
Semesters - Semi-cycles
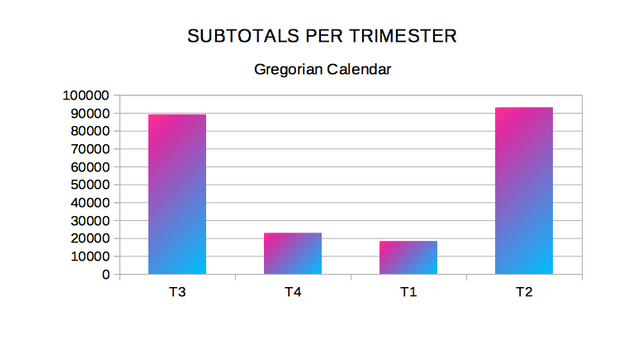
In the Gregorian calendar there is no difference between the two semesters of the year, however in the Natural calendar in the half-cycle, called POSITIVE that occurs in grades (0° to 180°) accumulates 81.91% of the accounts created in the first year .


Quarters - Seasons
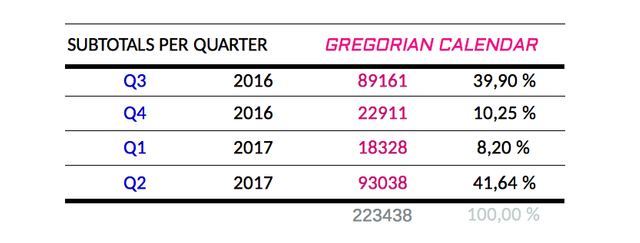
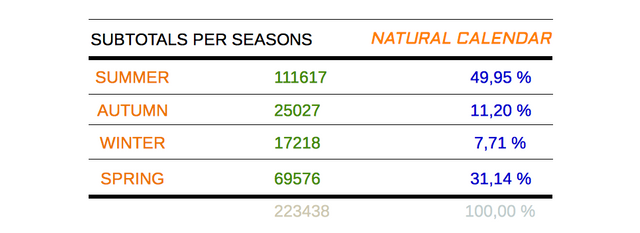
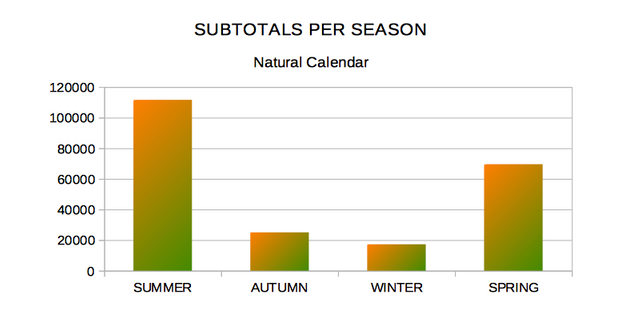
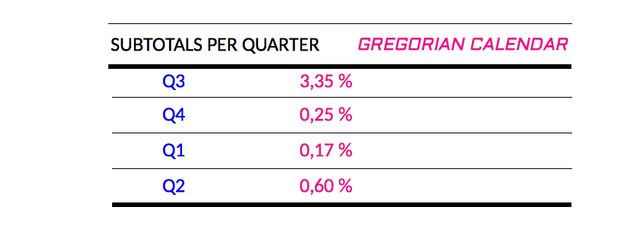
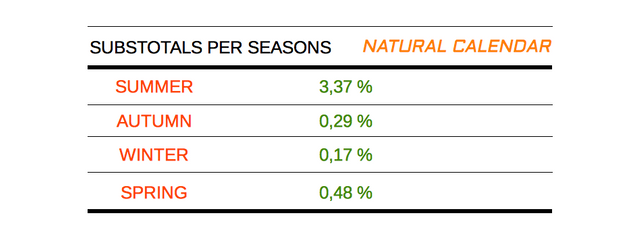
In this case, both the tables and the graphs are very similar due to the fact that the quarters division coincide fairly closely, but not exactly, with the seasons. In this case the use of the Natural calendar can be used to easily remember that in the first year of Steemit the largest number of accounts was created in the summer and in the spring.
Months - Sectors or Arc Types
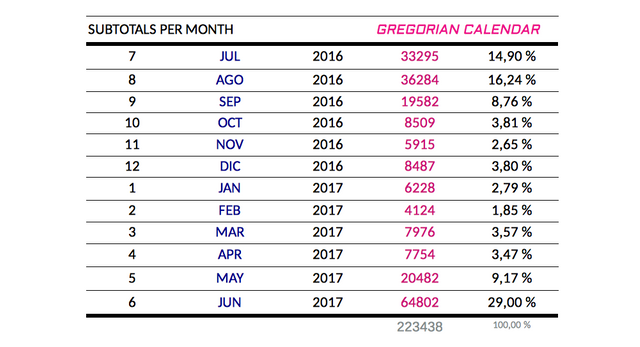
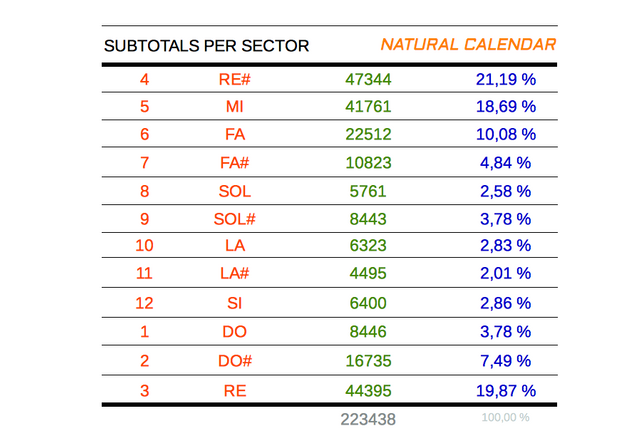
For the months and Sectors or Arcs, the resemblance could be classified as medium. The natural calendar shows a lower standard deviation.
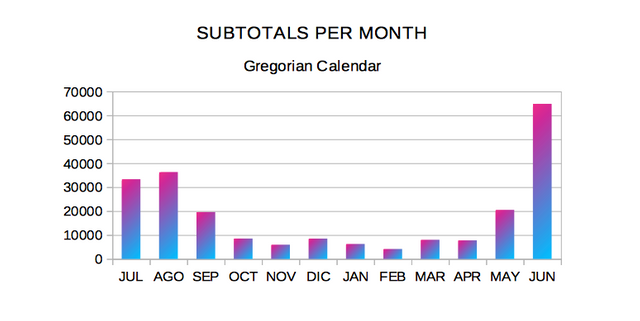
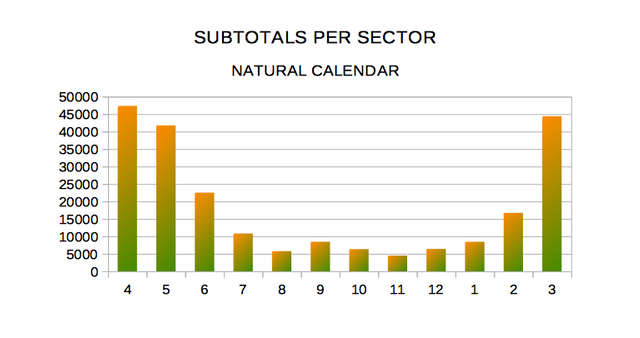
FOR AVERAGE VALUES OF DAILY RATE( %)
OF GROWTH OF NEW ACCOUNTS
Year - Cycle


NOTE
Do not confuse this value with the total rate of growth in the first year that would be 4738% when accumulating 223,438 new accounts to the 4,715 that already existed before the official launch.
Semesters - Semicycles


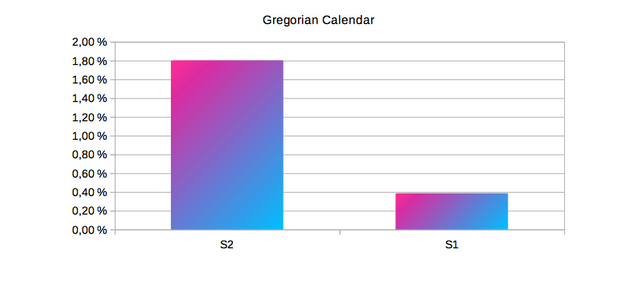
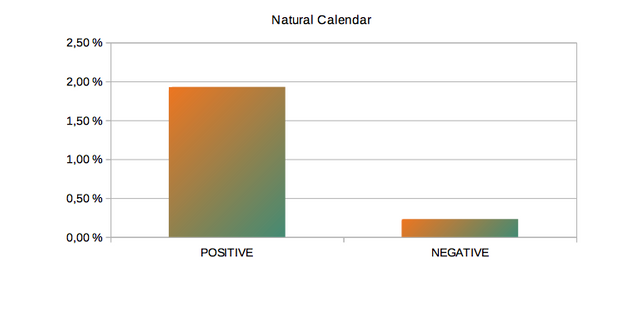
Quarters - Seasons
Months - Sectors or Arc types
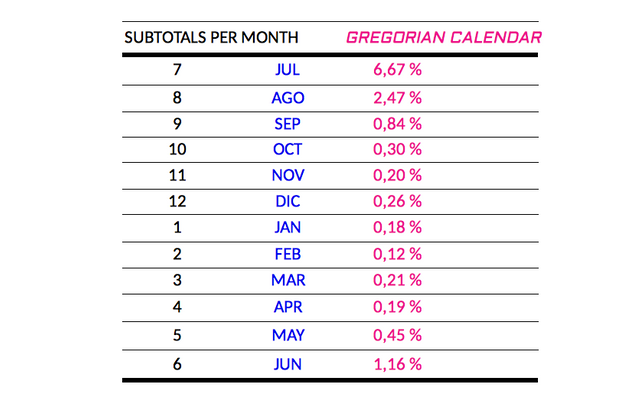
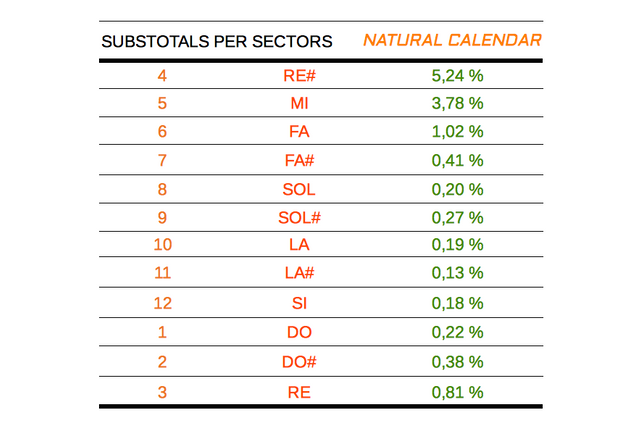
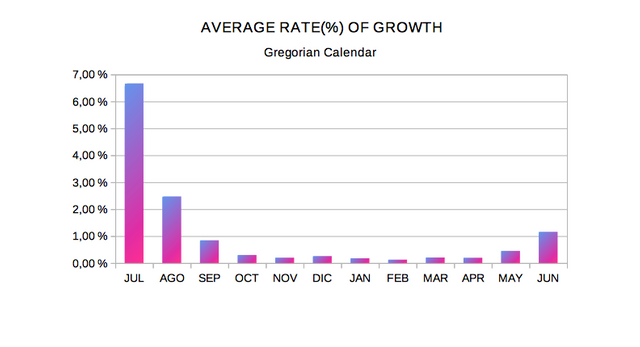
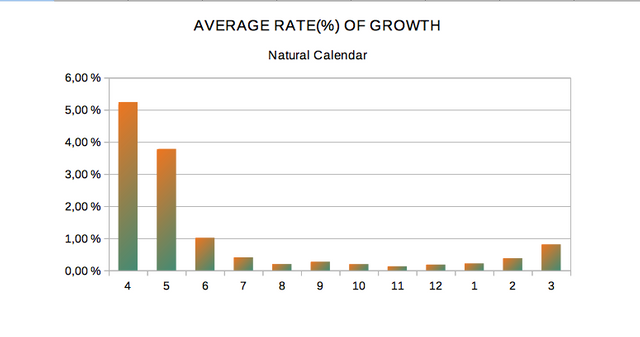

VII. SUMARY OF THE ANALYSIS
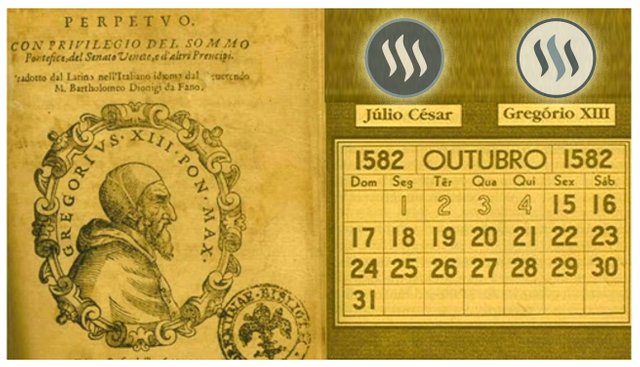
As expected, a different calendar implies a different processing of the data and therefore different results, although there is general coherence between the results. Just think that the Gregorian calendar was created from an ancient solar-tropical calendar based on the solar cycle and the division into 12 subperiods of time.
Then what can be concluded in this analysis by observing comparatively the tables, is that there are numerical differences between the two calendars. On the other hand, when we look at the graphs, if they are shown representing the real time evolution, the growth evolution of
Steemit in the two calendars express a similar shape in growth, which, on the other hand, is logical.
However, we must not forget that the Natural calendar has the advantage of having subdivisions or periods of time that define the calendar of equal size or length in degrees which seems more appropriate to perform statistical analysis instead of using a calendar with subdivisions of different sizes which introduces undoubtedly an artificial effect when processing the data to obtain statistical results.
The Gregorian calendar was not designed to do
statistical analysis on a spreadsheet.
The fundamental problem to use a new calendar is the inertia that we have to change something as integrated as the calendar that we use every day, even if it is not the most appropriate. In any case, it would be appropriate when an analysis is carried out to indicate explicitly the calendar used.
Maybe in the future, the spreadsheets will include the choice of differents calendars and doing the conversions of dates between different calendars automatically.
To conclude with the results on the growth of Steemit in numbers of new accounts, the following table shows a summary highlighting of the periods of higher and lower growth in both calendars for different groups or periods of time.
The growth of Steemit (new accounts)
during its first solar cycle (July 4th, 2016 - July 3rd, 2017)
| GREGORIAN CALENDAR | NATURAL CALENDAR |
|---|---|
| GREATER GROWTH | GREATER GROWTH |
| Semester: S2 | Semicycle: POSITIVE |
| Quarters: Q2,Q3 | Seasons: SUMMER |
| Months: JUN | Sectors or Arcs: 4,5,3 |
| LOWER GROWTH | LOWER GROWTH |
| Semester: S1 | Semicycle: NEGATIVE |
| Quarters: Q1, Q4 | Seasons: WINTER |
| Months: FEB | Sectors or Arcs: 11, 8 |
VIII. SOURCE OF THE DATA
Steemit Data
- The data has been taken from SteemSQL by using SteemSQL Wrapper developed by @emptyname.
- I used the following code to get the information
SELECT CONVERT(DATE, timestamp) as Date, COUNT(*) as [New Accounts]
FROM TxAccountCreates
WHERE   created >= 'timestamp >= '2016/03/30' AND timestamp < '2017/07/3'
 GROUP BY CONVERT(DATE, timestamp)
 ORDER BY CONVERT(DATE, timestamp) DESC
Astronomical Data

- Generated using the JPL DE405 planetary ephemerides - JPL Solar System Dynamics - NASA. which provides the Apparent Right Ascension of the Sun for the true equator and equinox of date (hours, minutes, seconds) accessing from the HORIZONS Web-Interface . This tool provides a web-based limited interface to JPL's HORIZONS system which can be used to generate ephemerides for solar-system bodies.

IX. ANALYSIS TOOLS
The raw data was verified and analysed in the spreadsheet application of the LibreOffice office suite. Graphs and charts also were produced using LibreOffice office.

This analysis was submitted on:
| GREGORIAN CALENDAR | NATURAL CALENDAR |
|---|---|
| Year: 2018 | Steemit Solar Cycle #2 |
| Month: March #3/12 | Arc Type #1/12 |
| Day: #20/31 | Arc type Angle: 0°/30 |
| Quarter #1/90 | Season: SPRING: 0°/90° |
| Semester #1/181 | Semicycle: POSITIVE: 0°/180° |

Thank You.
Posted on Utopian.io - Rewarding Open Source Contributors
Your contribution cannot be approved because it does not follow the Utopian Rules.
Dear @etheranoon, account creation statistics covering the time range you chose were shown before, one example here. I see no additional insights or conclusions on those numbers from grouping the same data into different time intervals and comparing those.
You can contact us on Discord.
[utopian-moderator]
Yes, I think I have read all the posts related to Steemit statistics.
In my analysis I present another point of view to show that the use of the Gregorian calendar distorts the results and that a more adequate calendar is possible. That is, my contribution places more emphasis on the method used than on the data. Sometimes we can't see the forest for the trees.
It is a more transcendental issue than it may seem at first glance, although fortunately the results have to be coherent with the previous analyzes.
thank you.
Hey @crokkon, I just gave you a tip for your hard work on moderation. Upvote this comment to support the utopian moderators and increase your future rewards!
Aaawww @crokkon, you honor me more than I deserve. Thanks!
Nice post..
Congratulations @etheranoon! You have completed some achievement on Steemit and have been rewarded with new badge(s) :
Click on any badge to view your own Board of Honor on SteemitBoard.
For more information about SteemitBoard, click here
If you no longer want to receive notifications, reply to this comment with the word
STOPCongratulations @etheranoon! You received a personal award!
Click here to view your Board
Do not miss the last post from @steemitboard: