Trading with triangles and flags - Crypto Academy / S5W2 - Homework Post for @sachin08
Thanks professor @sachin08 it's a well detailed course.
All charts I used in this assignment task is from TradingView and edited with Imarkup by me
1. What is your understanding about Triangles in Trading. Explain all forms of triangles in your own words. (Screenshot required)
We can describe Triangles in trading as horizontal trading cycle because at the beginning of its formation, the triangle is at its widest point. As the market keeps trading towards the sideways pattern, the trading range narrows and the triangle point forms. In its simplest way, the triangle point that losing interest in an issue, both from the buy and sell side: the supply line become smaller in other to meet the demand.
In another word, triangle pattern is a definite figure that forms on the price chart, it usually point out the price action tops the bottoms and how they move toward each other like triangle side. When the lover level and the upper level of a triangle act upon each other, an eventual breakout is expected from the triangle. In cases like that, so many traders use breakout triangle structure to identify breakout entry points
There are 3 types of triangle patterns, they are descending, ascending and symmetrical.
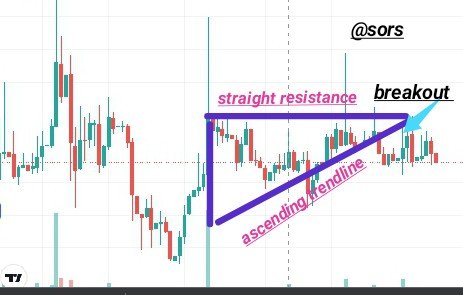
Ascending triangles are formation of bullish that prelude an upside breakout.
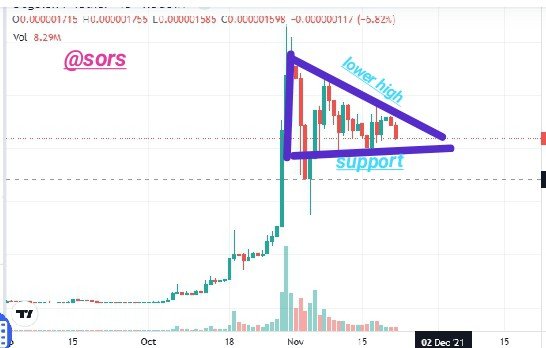
Descending triangles are formation of bearish that prelude a downside breakout.
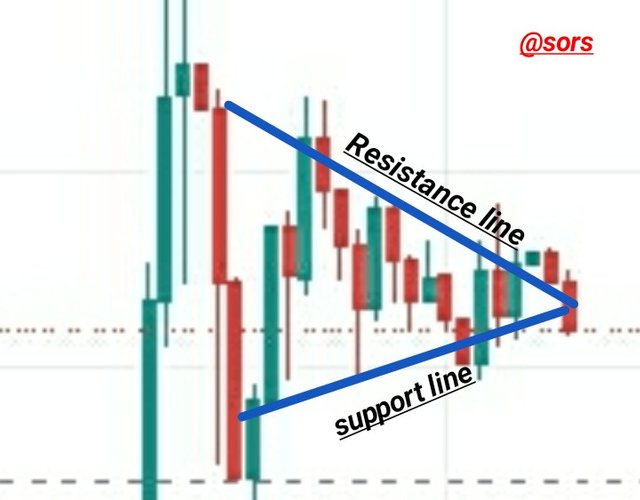
Symmetrical triangles are where action of price grows more and more narrow, it may be followed by a breakout to either up or down side.
2. Can we also use some Indicators along with it Triangle Patterns? Explain with Screenshots.
Yes we can use more indicators with Triangle pattern because indicators works on their own and triangle patterns works on their own as well. By using indicators like moving averages, we understand better on how the market is trending both bullish and bearish and using it with triangle pattern, it would give more enlightenment on how the price is moving.
For instance, in this an hour time frame Btc/usdt chart, the moving average follow the market movement
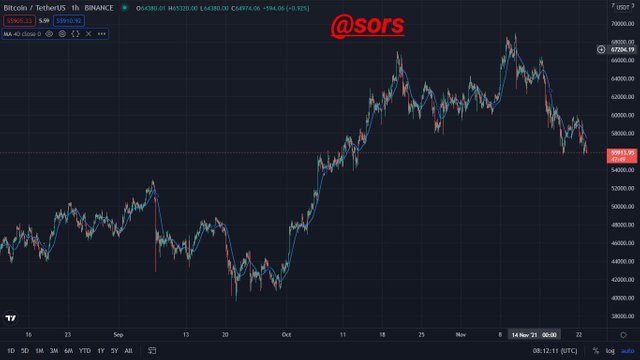
Using other indicator along with Triangle pattern
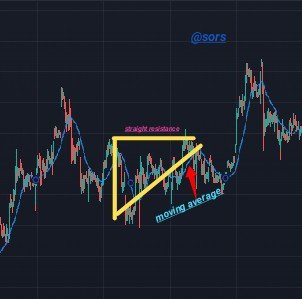
In this chart below, I draw an ascending triangles pattern with yellow colour and you can see how the moving average follows the market movement, the support line almost rhyme with the moving average.
3. Explain Flags in Trading in your own words and provide screenshots of both Bull Flag and Bear Flag.
Flags in trading are the areas of price tight solidification action that shows trend counter which it's movement follows after a sharp directional price movement. Flags trading patterns consists of five and twenty price bars. Flag in trading may come in upward trending bullish flag or downward trending bearish flag. The bottom of the flag should not pass the midpoint of the flagpole that goes before it.
Flags in trading have 5 characteristics;
- Price movement confirmation in same breakout direction
- Breakout
- Proceeding Trends
- Consolidation channel
- Volume pattern
Bullish and bearish Flags in trading have the same structures but the trend direction is different and deceptive differences in volume pattern. The bullish volume Flag trading pattern increases in the former trend and fall in the combination. By distinguish, bearish flag volume firstly increase and then wants to hold the level since bearish trends want to increase in volume as time advances.
Formation of Bullish flags happens when the channel slope connecting the highs and lows of combining prices after a meaningful move up is parallel and falling. The trend before the flag have to be up.
Formation of Bearish flags happens when the channel slope connecting the highs and the lows of combining prices after a meaningful move down is parallel and rising up. The trend that's before the flag have to be down.
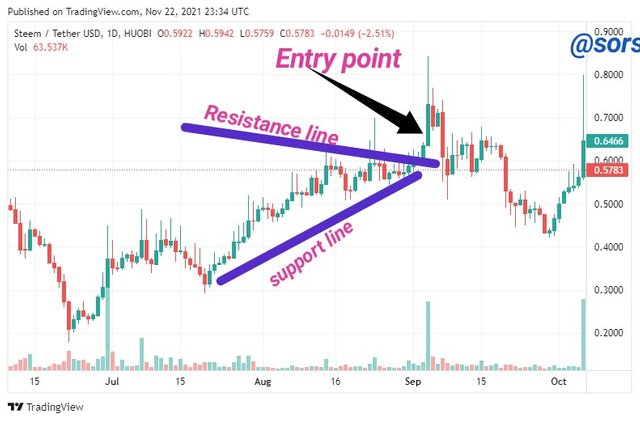
4. Show a full trade setup using these Patterns on any Cryptocurrency chart. (Ascending Triangle, Symmetrical Triangle, Bear Flag)
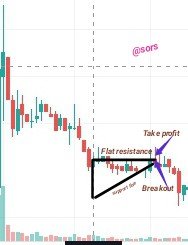
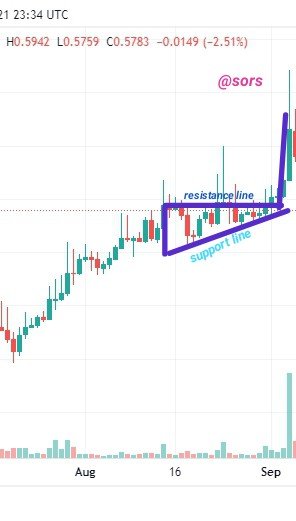
Ascending triangle
Descending Triangle
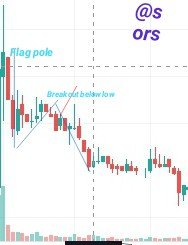
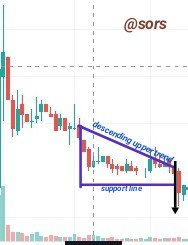
Bear Flag
Conclusion
Triangle in trading helps traders identify the trends or understand what the market condition is. Using more indicators like moving averages with triangle pattern would give traders more clue on what the market condition is.
If a trader understand the flag, he would know when the market price is possible to move upward or downward (bullish or bearish) which would make trader know when to buy and when to sell.
100% power up
excellent publication friend
Thanks