Homework Task-Steemit Crypto Academy | Week 12 | Course By @kouba01
(A). What is the Relative Strength Index - RSI and How is it Calculated
Relative Strength Index RSI is an indicator created by a technical analyst J. Welles Wilder, to indicate the the momentum and fluctuations of prices. It has an oscillation between zero to 100.
It is used by traders in technical analysis TA to measure price fluctuations and make it easier to spot what condition the market is.
To get a better concepts of the indicator you are using, it's good to know how RSI indicator is calculated eventhough it is not quite necessary in any decisions of trading strategy.
RSI is calculated using the average gains over a high period over a given period by Average loss over a high period over a given period of time .
It usually consider two sets of signals as overbought divergent when the level rise above 70 or as oversold divergent when the level rips below 30 and might remain on same signals for a while when there's a strong trends.
(B). Can we trust the RSI on cryptocurrency trading and why?
RSI is a very good indicator and have the most reliable signals just like most indicators especially when it's conform to long term trend.
RSI indicator is reliable because it brings about a lot of clarity to a price movement that is seemed to be random it compares the bullish and bearish price fluctuations and shows up the results in an oscillator which can be put under a price chart.
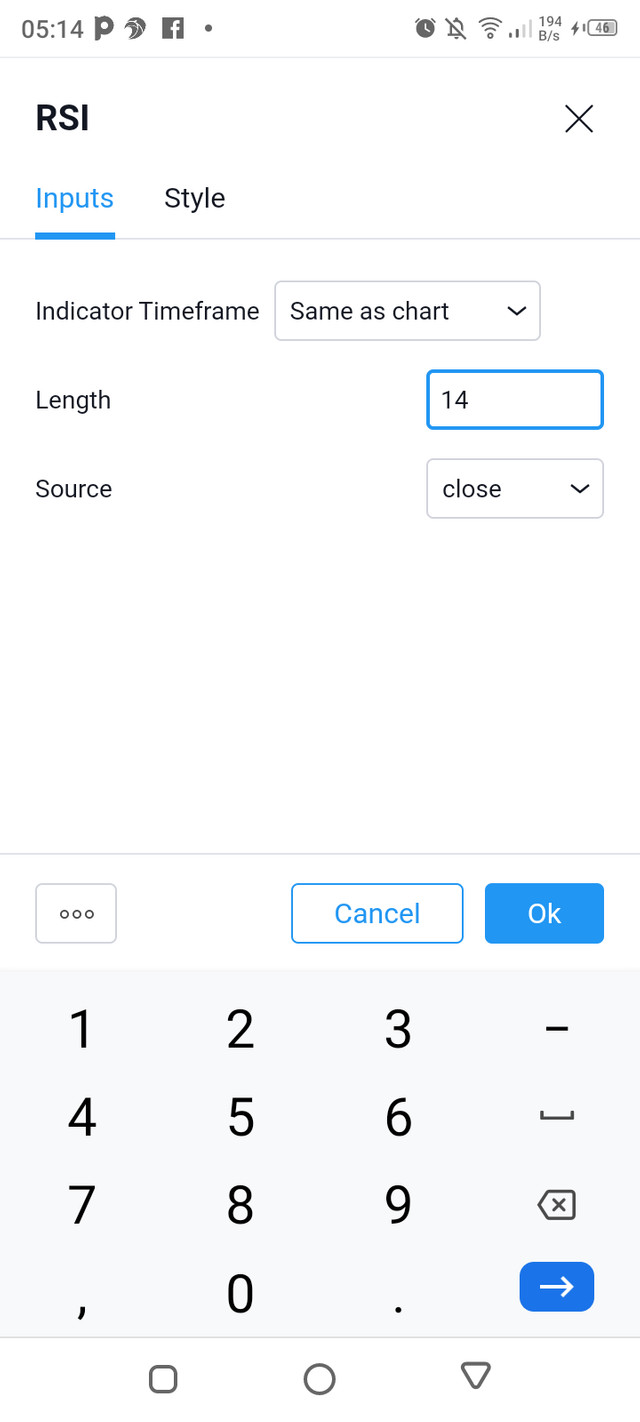
(C). How do you configure the RSI indicator on the chart and what does the length parameter mean?
Why is it equal to 14 by default? Can we change it? (Screenshots required)
To configure RSI indicator using trading view platform chart, right click on the RSI and make sure that you are on the indicator's line to have the menus where you can adjust the color and background.
The length parameters decides the stability or volatility of how RSI will be and at how soon the RSI indicator will reflect to the changes in market conditions RSI indicator is equal to 14 by default because 14 timeframe is a period that is suitable to most traders and it is usually measured on a 0 to 100 scale with a high level marked at 70 and low level marked at 30. Yes The default timeframe can be change and the best timeframe is in-between 2 and 6.
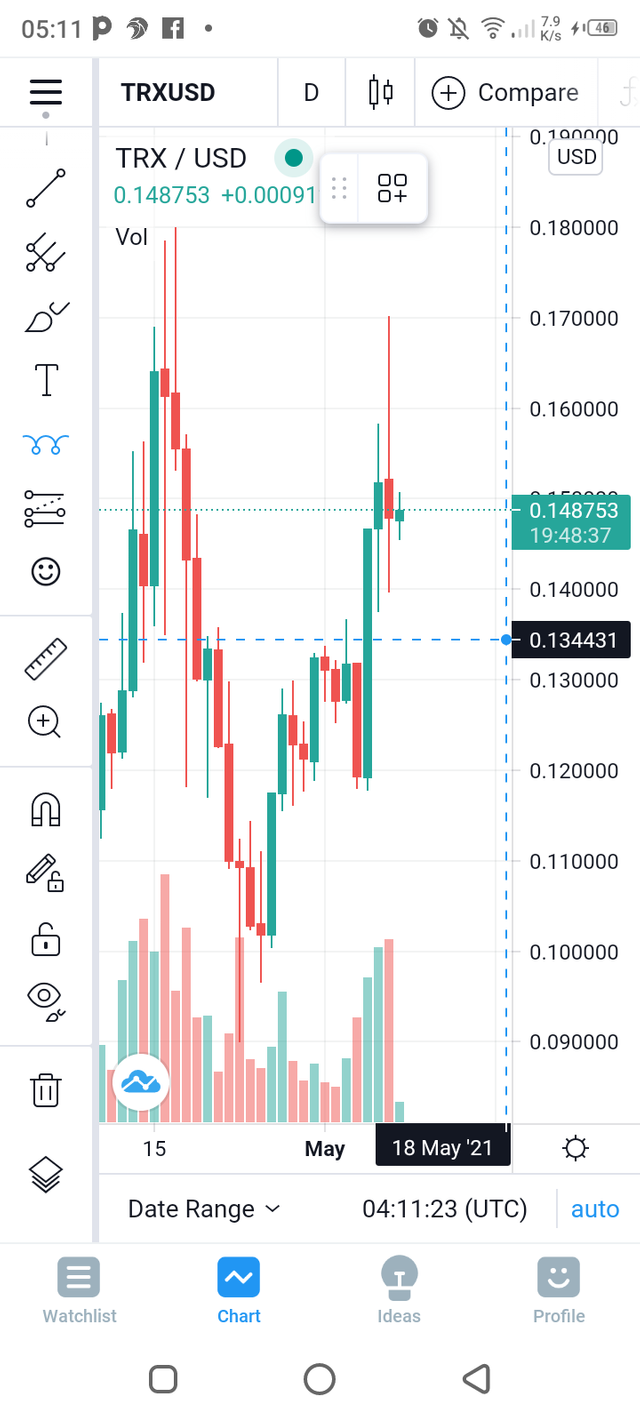
The first photo above shows how a chart in tradingview platform is with no RSI
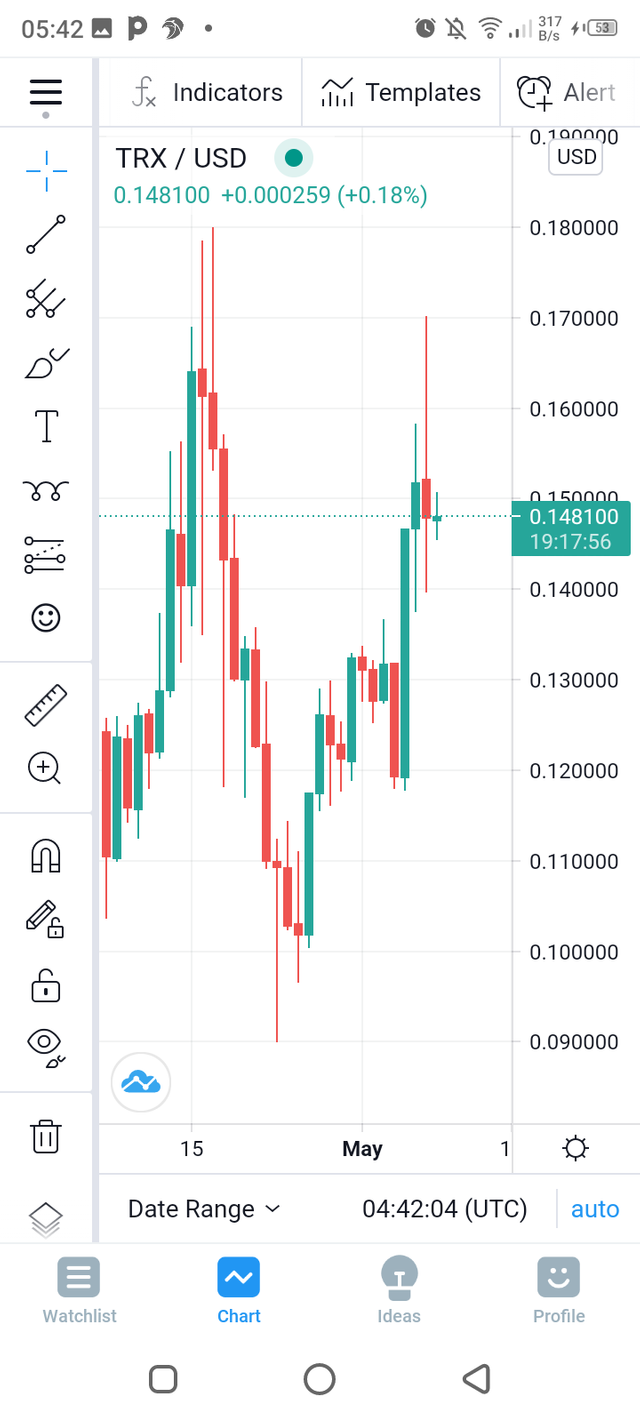
The second photo shows the user is scrolling on the top right way of the page and clicking on the fx indicator tab.
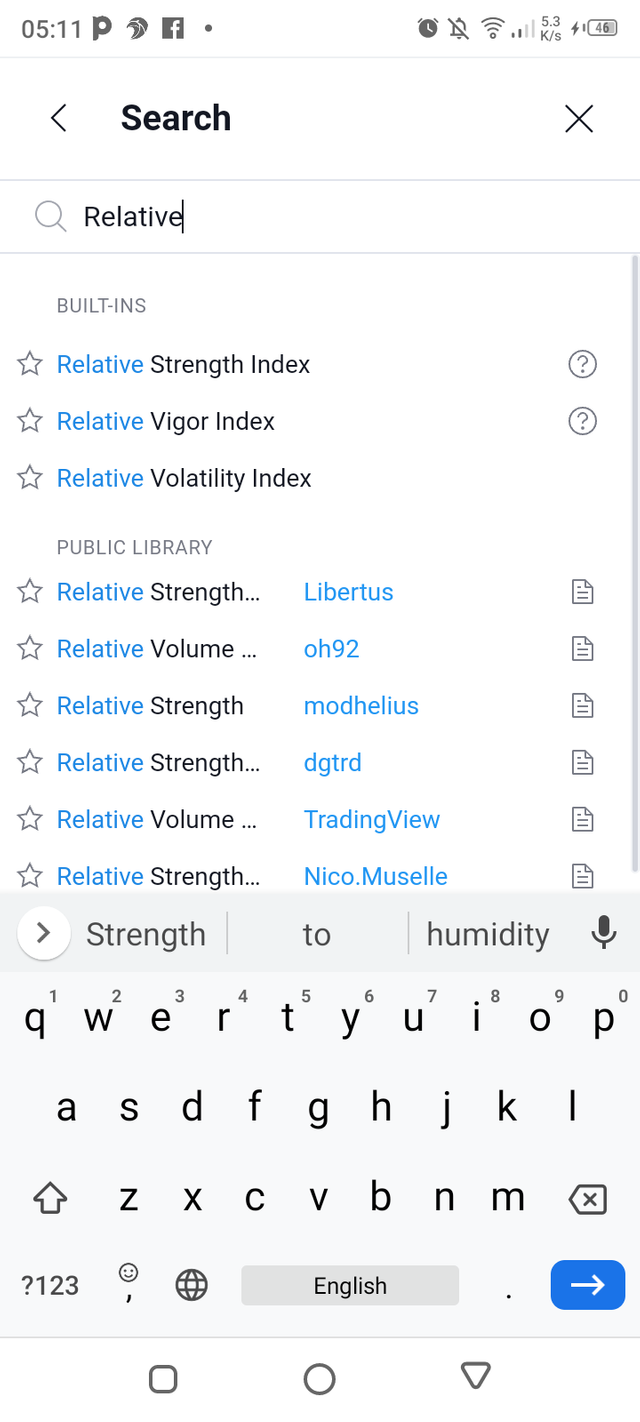
The third photo is showing the user searching for RSI indicator
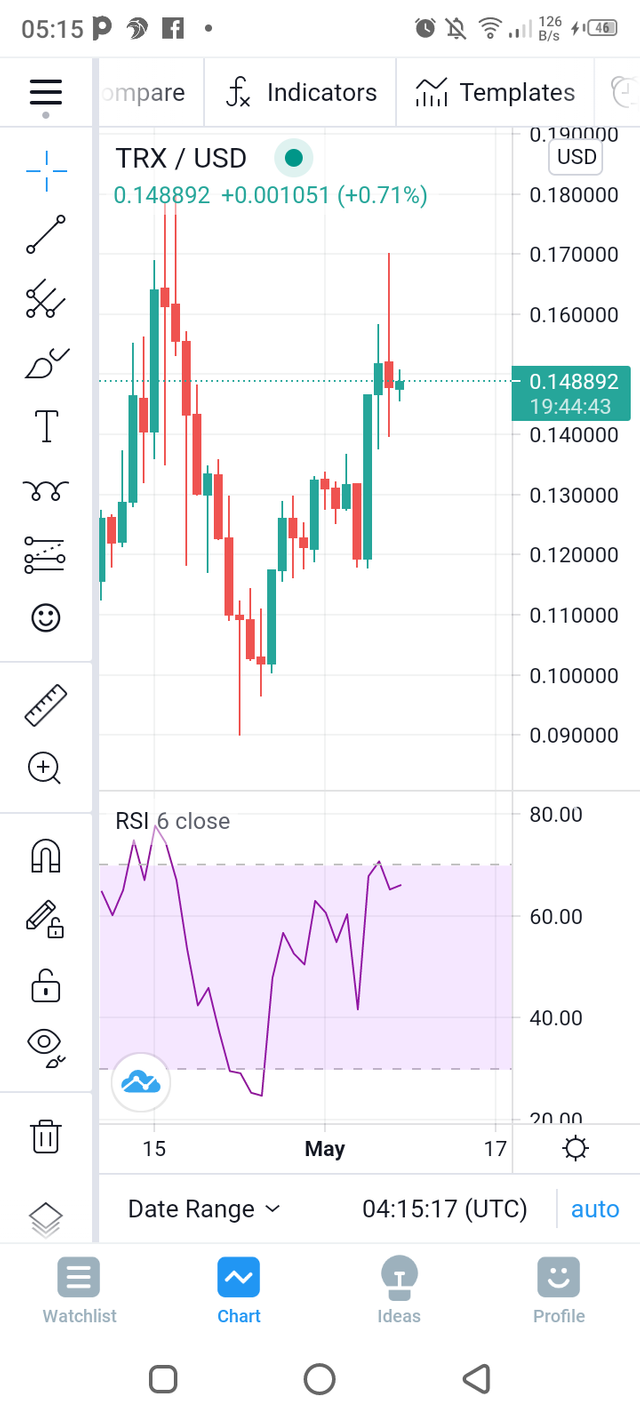
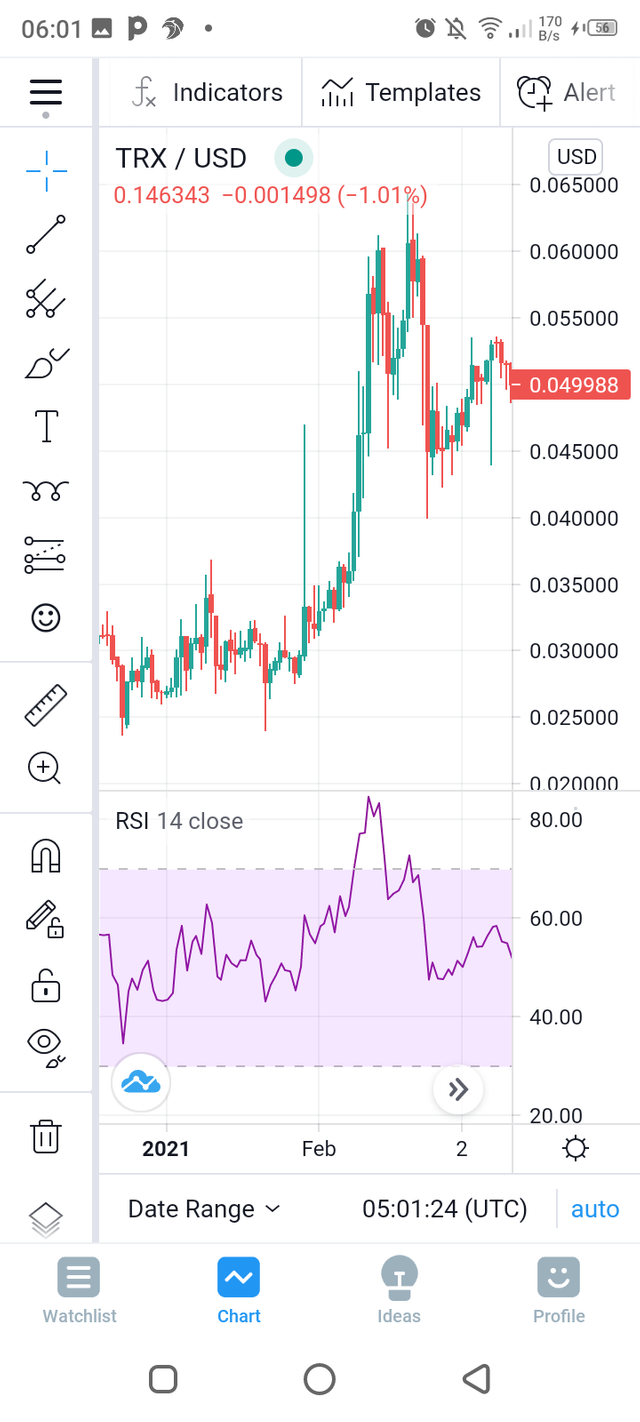
The fourth photo shows how the RSI is added and configure in the chart
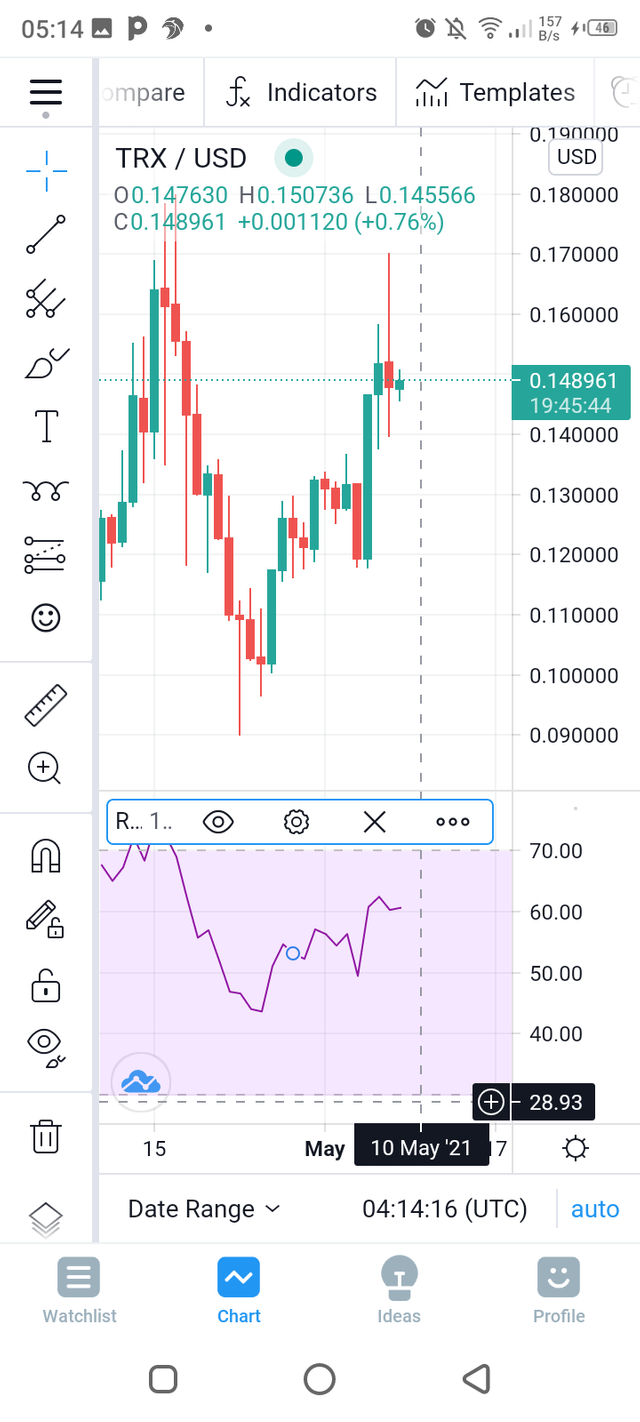
The fifth picture shows how to tap on the RSI and make some amendment to the users taste
And the sixth and last photo shows how to change the default timeframe in the RSI.
(D). How do you interpret the overbought and oversold signals when trading cryptocurrencies? (Screenshots required)
The above pic shows the simplest interpretation of an overbought and oversold market conditions.
The Red arrow shows how the RSI indicator rise to above 80 scale and which means that the demand is higher than the supply thus having an overbought divergent situation.
The green arrow on the other hand shows how the RSI indicator dropped below the scale of 30 which means that the supply is higher than the demand and that makes the product price to drop thus having an oversold divergent market conditions.
(E) How do we filter RSI signals to distinguish and recognize true signals from false signals. (Screenshots required)
We can distinguish between a true and false signals when the market trends shows a contradicting scale with the RSI indicator.
There maybe be an instance where the market price is showing a lower price dip and the RSI indicator is showing a higher dip and then we will say to have a bullish divergent as shown in the picture below
A bullish divergent.
There maybe be an instance where the market price is showing a higher price dip and the RSI indicator is showing a lower dip and then we will say to have a bearish divergent as shown in the picture below.
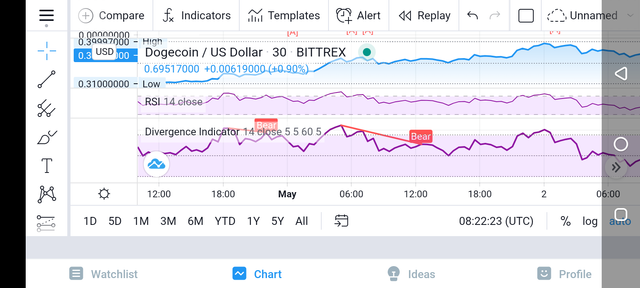
A bearish divergent.
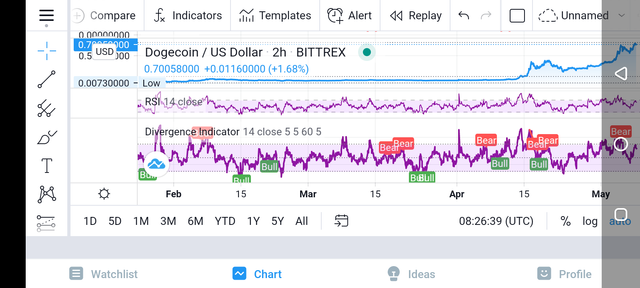
(F). Review the chart of any pair (eg TRX / USD) and present the various signals from the RSI. (Screenshots required)
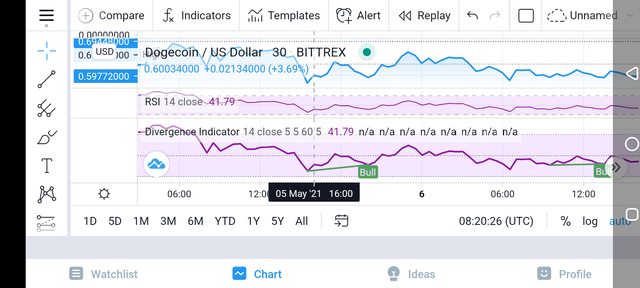
The photo below shows a six months review chart of various signals from RSI indicator of DOGECOIN/USDDOLLAR . The divergence indicator in the tradingview platform shows exactly what type of signal occur during the given period of time.
Hello @sandra484,
Thank you for participating in the 4th Week Crypto Course in its second season and for your efforts to complete the suggested tasks, you deserve a 3/10 rating, according to the following scale:
My review :
An article lacks a lot of work in terms of information and analysis, which made your answers unclear.
Thanks again for your effort, and we look forward to reading your next work.
Sincerely,@kouba01