Trading with Accumulation / Distribution (A/D) Indicator - Crypto Academy / S4W5 - Homework Post for @allbert

1- Explain in your own words what the A/D Indicator is and how and why it relates to volume. (Screenshots needed).
An Indicator is a technical tool used by traders to increase their chances of making profits and to minimise the chances of losses. Indicators help us to spot the various opportunities of the market to make the right trading decisions.
A/D indicator Is a type of indicator that uses the price and volume of an asset to predict the accumulation and distribution phases of the market. This indicator uses the data available and shows us the amount of money entering or coming out of the market.
when the price of an asset is rising with the rise of volume, we call this phase an accumulation phase of the market. In this phase of the market, the demand and the volume of asset in the market is very high and more and more traders are ready to buy the asset that results in an increase in the volume and the price of the asset into the market.
When the price, volume and demand of an asset starts decreasing from the market as traders begin to sell their holdings, this phase of the market is called as distribution phase where volume, as well as the demand of asset, is low into the market. In the accumulation phase money is added to the market, while in the distribution phase money is taken out of the market which pushes the market down.
2- Through some platforms, show the process of how to place the A/D Indicator.
To demonstrate the process of adding the A / D Indicator to a chart, I will be using the trading view platform by visiting the official site.
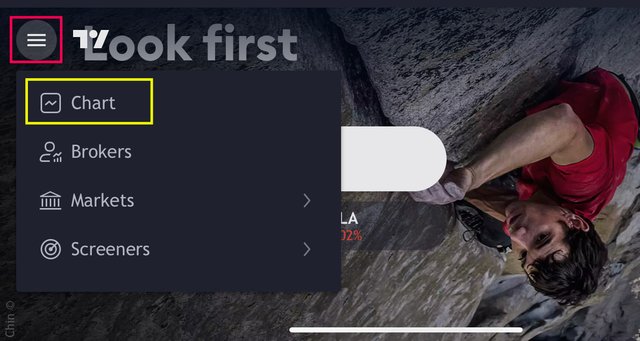
On the tradingview platform homepage, click on Charts.
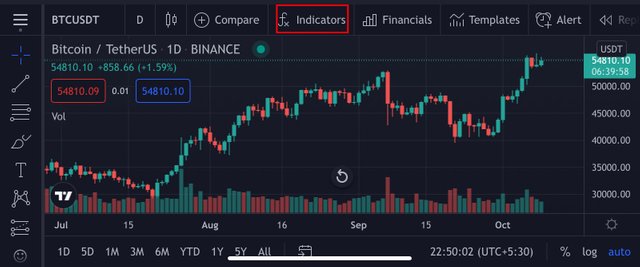
After clicking on charts, the chart page opens. On the chart page, click on the Indicators.
After clicking on the indicators button, an indicator search box opens up, search for Accumulation/Distribution Indicator.
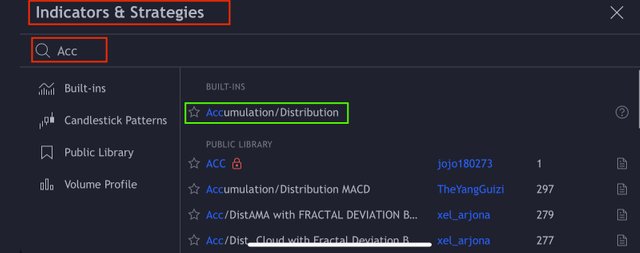
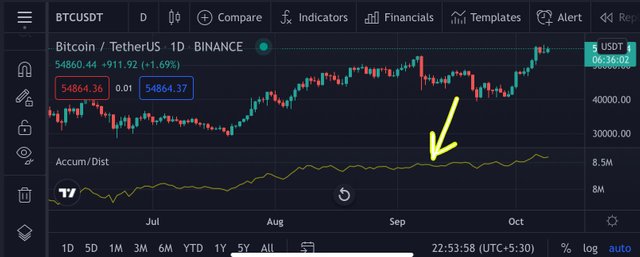
The Accumulation/Distribution Indicator was added to the chart as shown below.
3- Explain through an example the formula of the A/D Indicator. (Originality will be taken into account).
Money Flow Volume=MFM×Period Volume
MFM=Close−Low - High−Close/ High−Low
A/D=Previous A/D+CMFV
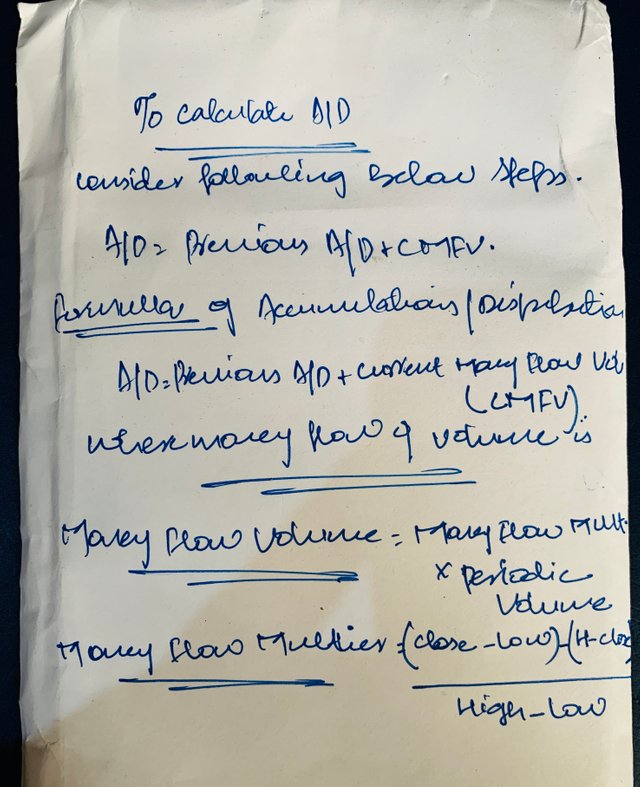
The Flow of Money is measured when the low price subtracts the closing price, minus the difference between the high and close price, then divided by the difference between the highest price and the lowest price.
Parameters included in calculating A/D Indicator are:-
!)The formula for calculating the Money flow multiplier is:- MFM= (CP-LP) - (HP-CP)/ HP-LP.
Where,
CP= Closing price
HP= High Price
LP= Low Price
!!) Money Flow Volume is calculated as by:- Money Flow Volume= MFM x VP.
Where,
VP= The volume of the Period.
!!!) previous A/D line indicated by P(A/D),
where,
A/D= MFM + MFV x P(A/D)
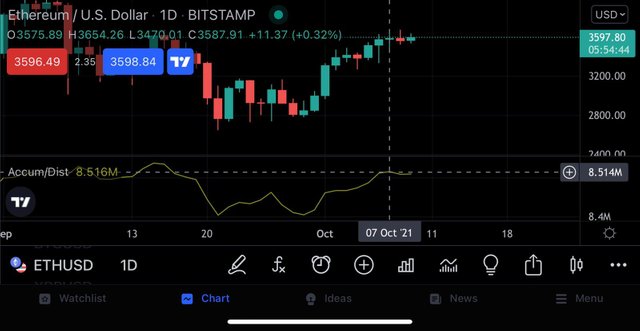
Now, we will use the below screenshot and the above-written formula to calculate the previous A/D indicator and formula.
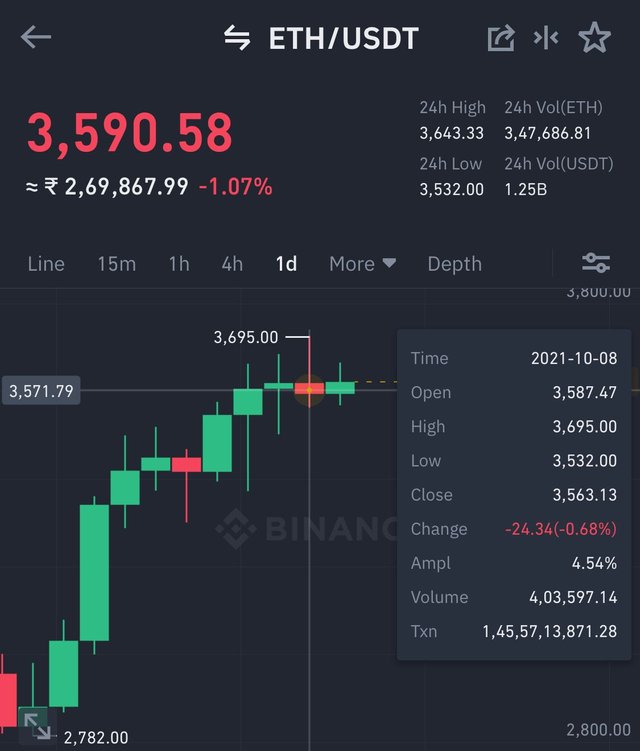
Using all the above equations and formulas
Previous A/D = 8.514M
Current A/D = 8.51M
Open = 3587.47
Close = 3563.13
High = 3695
Low = 3532
Periodic volume = 3999
MFM = (3563.13 - 3532) - (3695 - 3563.13) / (3695 - 3532)
MFM = (31.13) - ( 131.85) / 163
MFM = -0.617
CMFV = -0.617 * 3999
CMFW = - 2467
A/D = 8514000 + (-2467) = 8511533
4- How is it possible to detect and confirm a trend through the A/D indicator? (Screenshots needed).
Accumulation/Distribution is a type of indicator that can be used to predict the price and trend reversals of assets into the market.
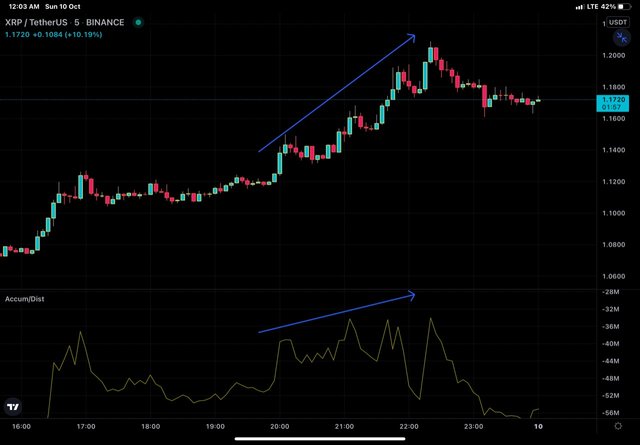
If the price of an asset rises and the A/D indicator is projecting upwards, we can say that the forthcoming trend will be bullish. In this trend, money is added to the market by the traders which push the market up and the volume of an asset increases and we say that asset is in the accumulation phase.
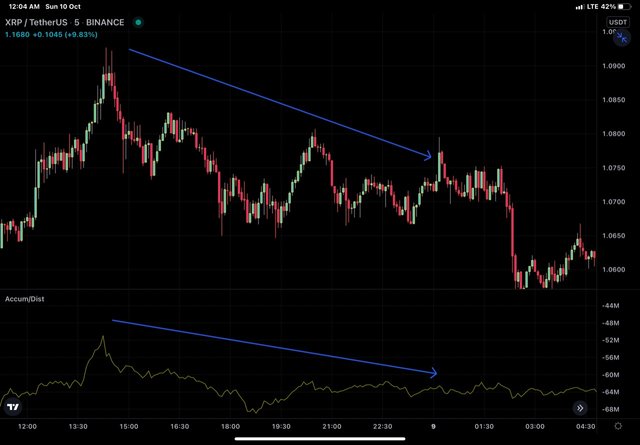
If the price of an asset is declining and the A/D line is also moving down, it means that money is being moved out of the market and assets are being sold by the holders. This means the asset is not in demand, and the supply is high, indicating an increase in selling pressure.
Src
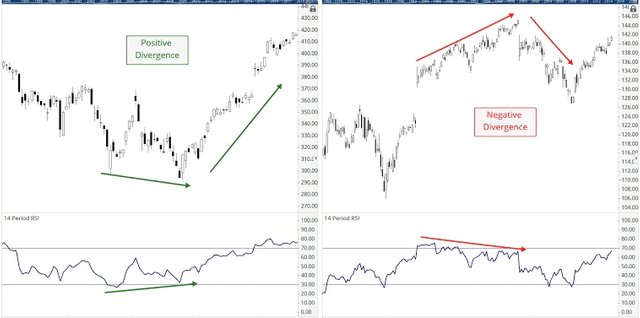
positive and negative divergence
When the price of an asset moves in one direction and A/D moves in the opposite direction we call it divergence. If the price of an asset goes up and A/D goes down, we expect the price to fall and called this phase a negative divergence. And if the price of an asset is decreasing and AD Indicator is projected upwards, it means a positive divergence and indicates the upcoming bullish trend.
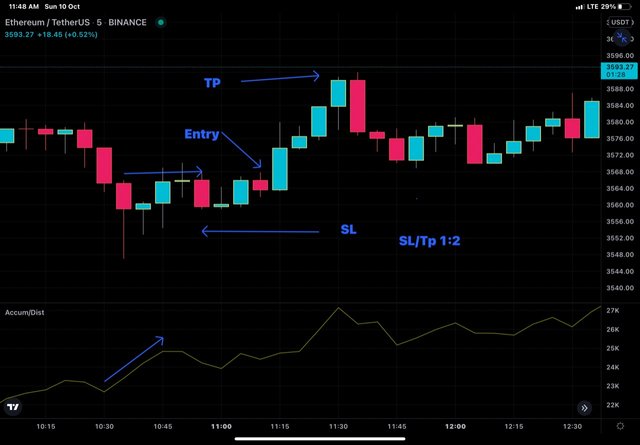
Question 5: Through a DEMO account, perform one trading operation (BUY or SELL) using the A/D Indicator only. (Screenshots needed).
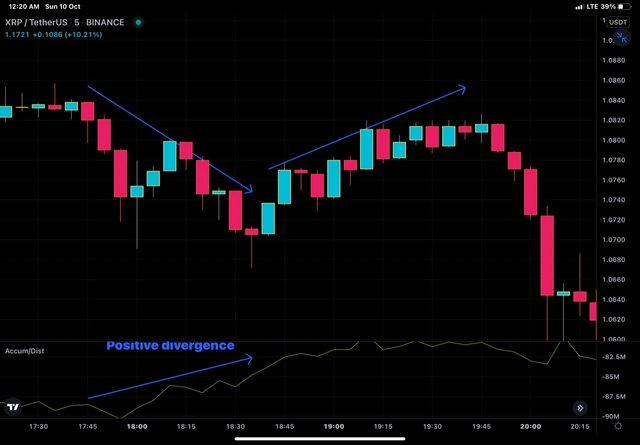
I have spotted a buy trade in ETH/USDT, see the screenshot below.
In the ETH/USDT chart above I have spotted a bullish/positive divergence, we can see that on the price chart for a particular segment under consideration price is consolidating in a range where the accumulation distribution indicator is showing an uptrend indicating that price is going to rise, so providing a buy signal.
I have placed buying buy entry at the bullish candle that breaks above the consolidating level and placed take profit and stop loss, such a that SL:TP= 1:2.we can see that the break of consoldation is followed by the bullish rally of price and hit TP as expected.
6- What other indicator can be used together with the A / D indicator? Justify, explain and test. (Screenshots needed).
No indicator is 100% accurate that's why we should always use 2 or more indicators to spot the best positions to enter or exit the market. To confirm the trends and to predict the market I'll be using Experimental Moving Average Indicator to support the A/D indicator to spot the best positions.
The A/D indicator does not detect small changes in volume and price movements and also it misses the prices changes between the different periods that's why we have to use another indicator to support it.
I'll configure the indicator from 55 and the other at 21 in length. When the EMA 21 line crosses over the EMA 55 line, we can say the golden cross is about to happen and we can buy more assets and hold till the bullish rally starts. And when the EMA 55 line crosses over the EMA 21 line, it is called the death cross. In this phase, we expect the price to fall, which means it is a clear cut signal to sell holdings.
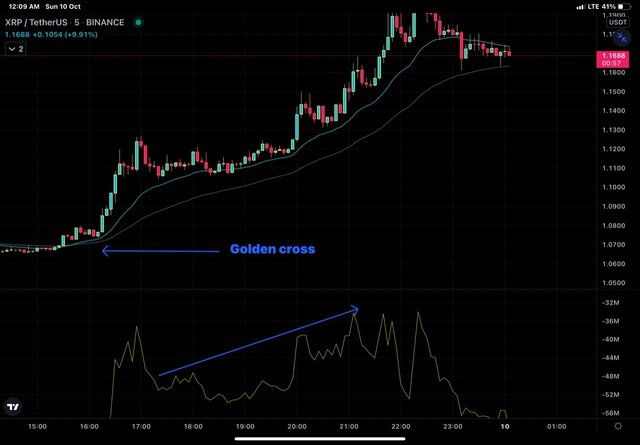
In the above screenshot, you can see the A/D indication showing the accumulation phase and so is shown by the EMA indicator. After the GC price of an asset rises thus EMA can be a good indicator to be used with the A/D indicator.
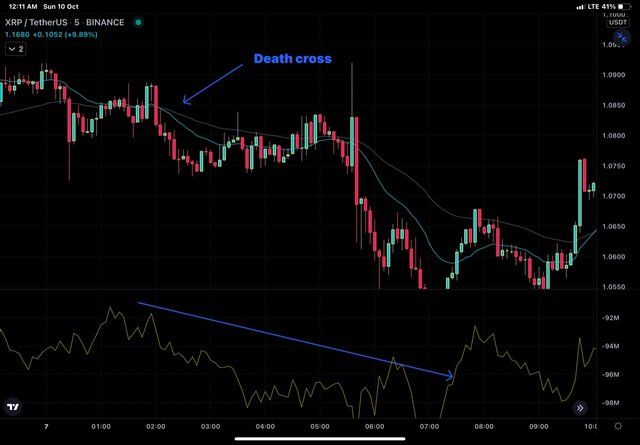
In the above screenshot, you can see the A/D indication showing the distribution phase and so is shown by the EMA indicator. After the DC price of an asset decreases sharply, we co concluded that EMA is a good indicator to use alongside A/D can be a good indicator to be used with A/D indicator.
Conclusion
Indicators are very helpful for traders to spot different trends of the market, the A/D indicator is one among them. It is used to detect the money flow into the market. And we can increase the effectiveness of A/D indication by using other indicators like EMA, RSI.
Thanks, @allbert for this wonderful lecture...
Hello @aamir07 Thank you for participating in Steemit Crypto Academy season 4 week 5.
You have been upvoted by @sapwood, a Country Representative from INDIA. We are voting with the Steemit Community Curator @steemcurator07 account to support the newcomers coming into Steemit.
Engagement is essential to foster a sense of community. Therefore we would request our members to visit each other's post and make insightful comments.
Thank you.