You are viewing a single comment's thread from:
RE: Check out D-Tube and lets mark up some charts
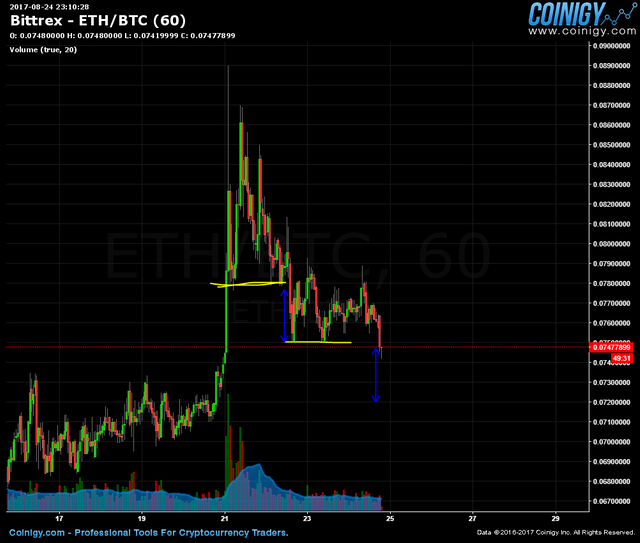
I think best to illustrate from a higher level of view shown on my pic. the yellow are better bases, and blue arrows are panic drops. Your bases you drew are ok to use, but I prefer bases with MULTIPLE TESTS. As you can see there were two tests on each of my yellow line. Your entry point (buy) seems wrong and should be on these panics where the blue arrows are, THEN sell close to the base.
The crux of this analysis tho is that these are still small percentage trades like 2-3%. I would take an even higher overview if you want the 10%+ trades.
I know this is isn't coming from Luc himself, but hope this helps
Yes thanks for the input..always helpful!