RE: Check out D-Tube and lets mark up some charts
Ok @quickfingersluc I did my first "day trade" last night. Everything I have done before this is buy and HODL...
I've been following a few of your recommended steady eddy charts..particularly BTC/USDT and ETH/BTC
Tell me what you think...
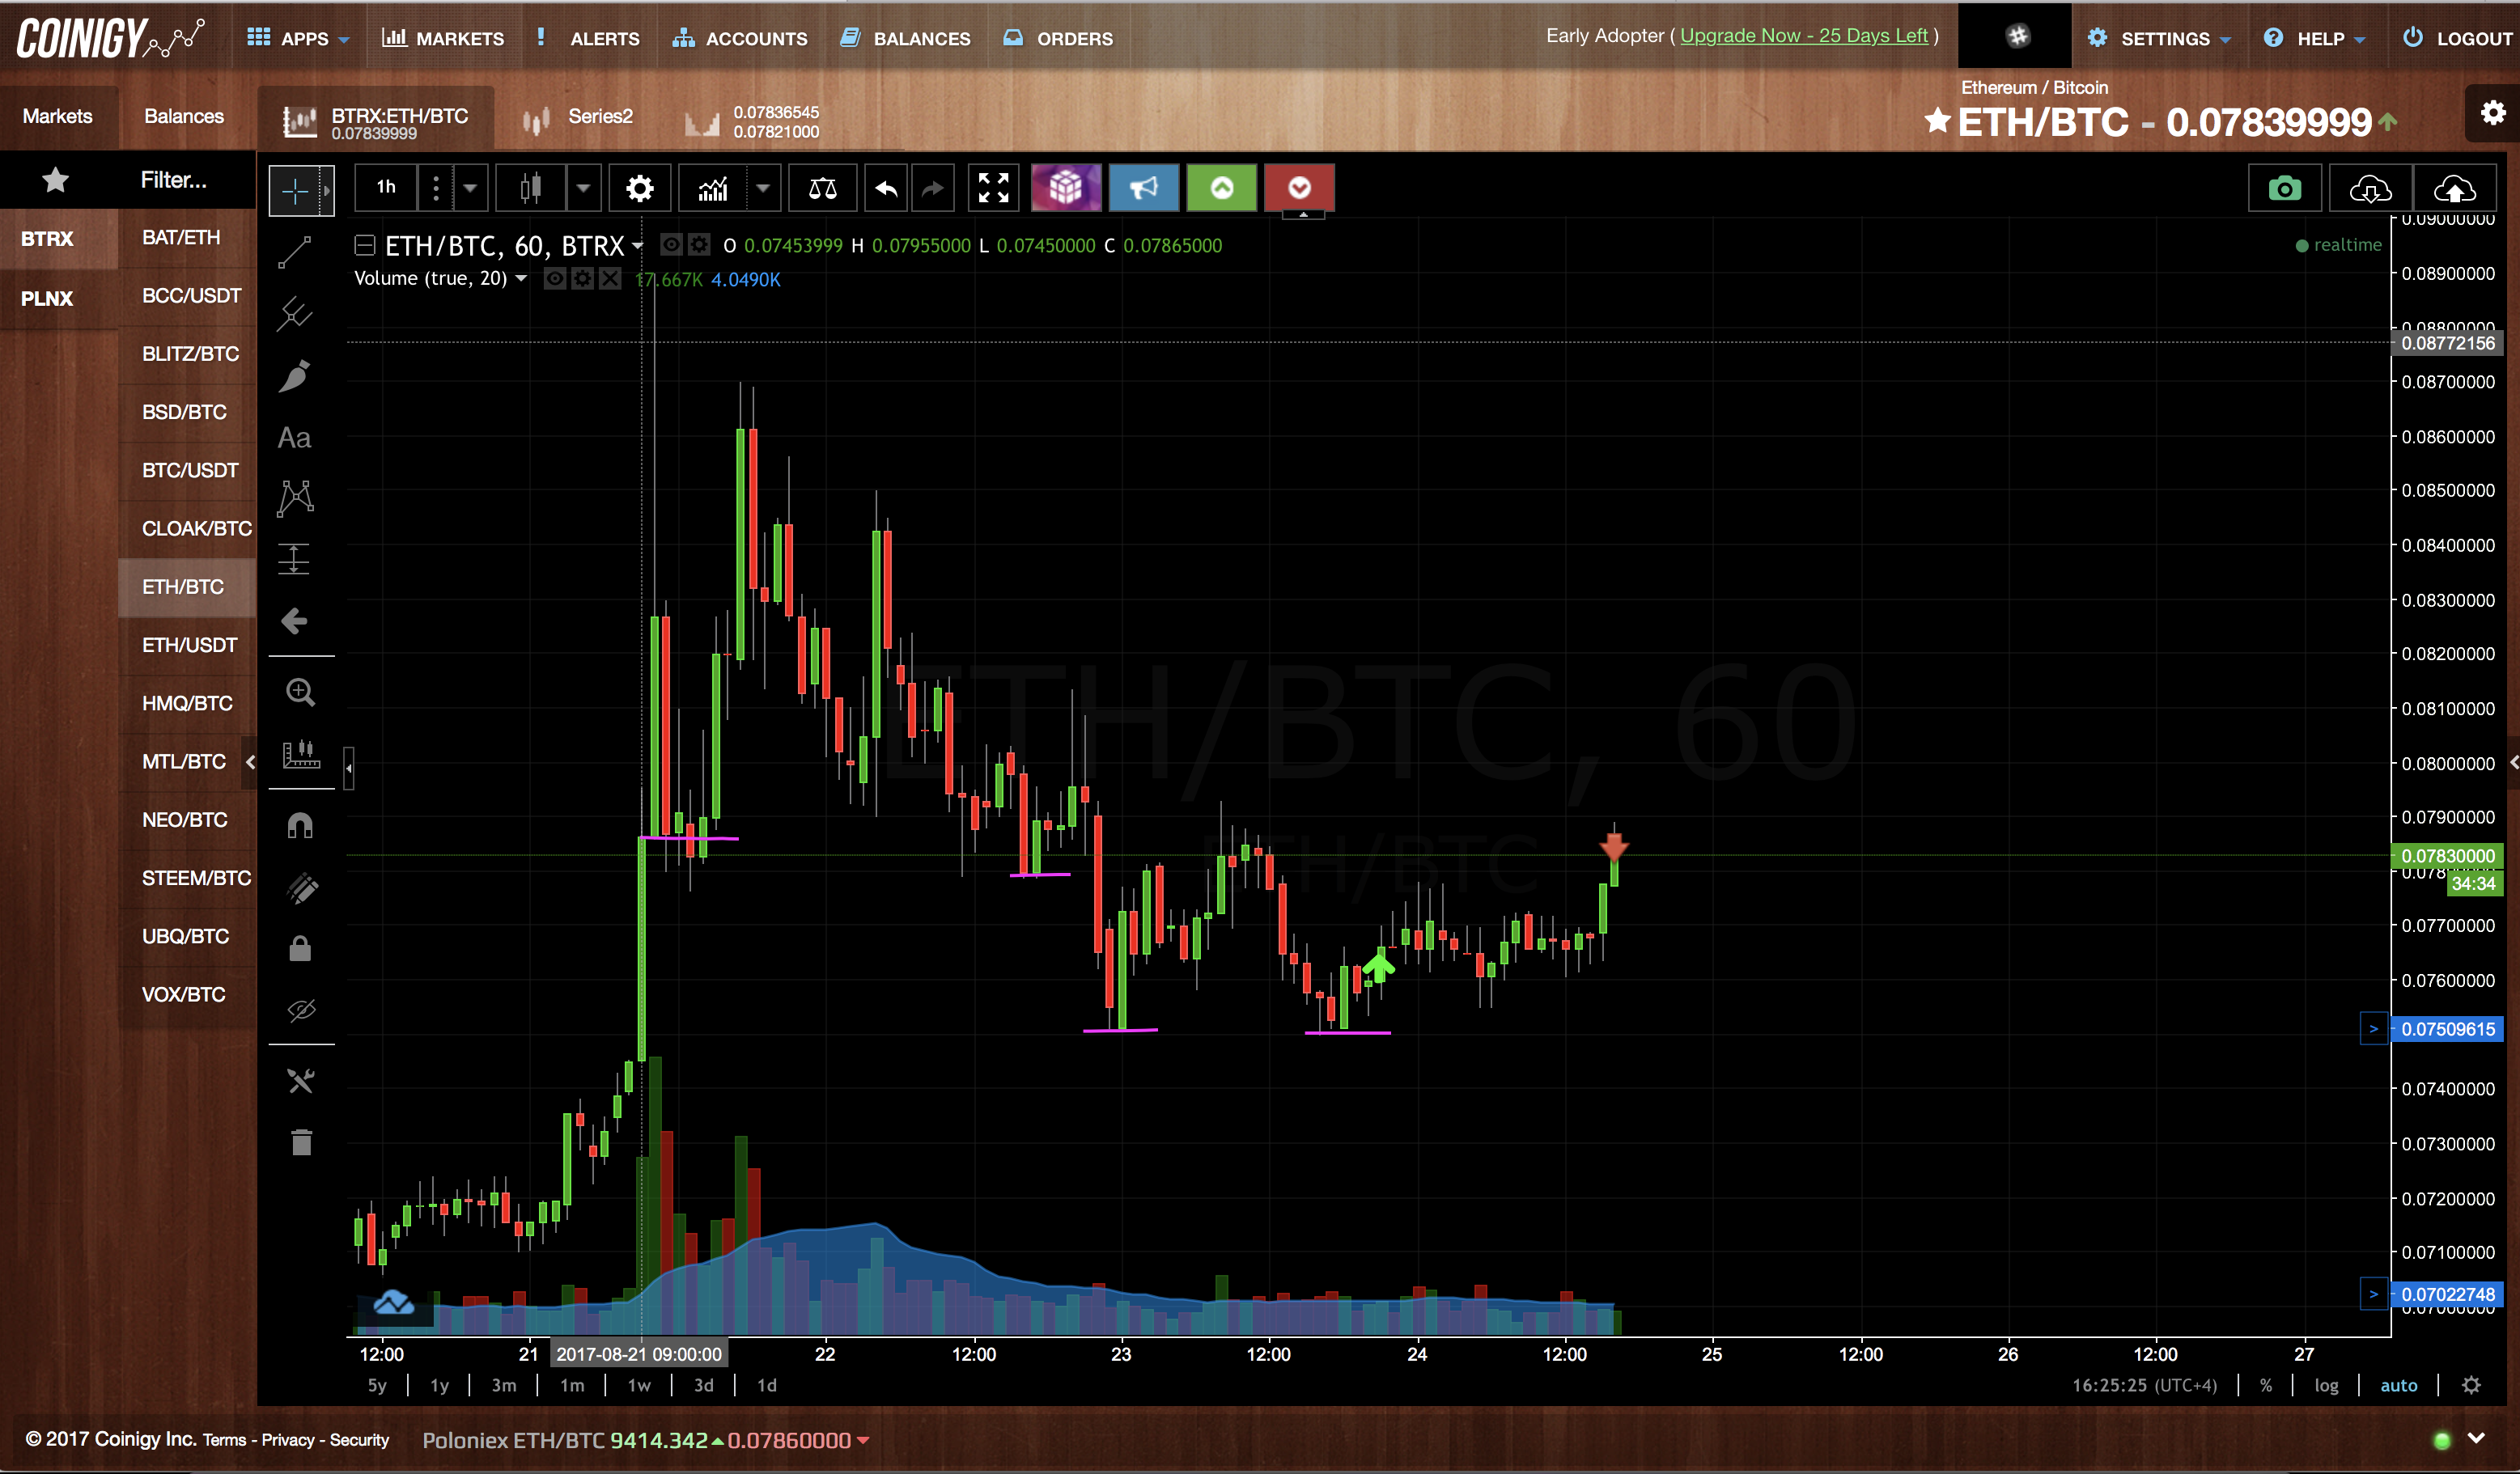
I placed a very clear solid base at .0786, then smaller bases at .0779 and .0750. After looking at the 2 month timeline I thought I could play off of the clear base at .0786, it did break that base and rebound making my newest base the .0750.
It never broke the .0750 base and had broken the major base and returned twice soo..... I took a gamble and bought 1.5 ETH at the Green arrow and sold at the Red.
Any advice? In the future when you place the sell limit on the graph is there a way to change it without canceling and replacing?
I'm a dentist and as we all know doctors are the worst with money so I can't thank you enough for your guidance! Hopefully one of these days my crypto investments will pay off my 330K in student loan debt!
Thanks!
David
tl;dr base is at 750 u bought the broken and returned base, and sold on another bounce which went to the same level and retested it
in position trading only first bounce is guaranteed
if u are daytrading use 5min or 15min candles and draw bases off there if you wish to use the method
Thanks nbiroz, so your saying Luc's method is really only valid on the most recent base in regards to a safe bet...when using previous bases and the retesting of those bases there is less predictability of the chart direction...correct?
the theory tells yo to care only about 1 or 2 last bases(unbroken i assume) in 2 months zoom out, and to trade panic sells. But it is your choice to trade any crack or drop you see sufficient. I am not sure how you would go about calculating your probababilities.
smaller bases are useful for daytrading where u can zoom in on 2 weeks or less chart and use 5 or 15 min candles for buying dips below these bases.
position trading relies on buying below major breaks and waiting for first bounce that almost retouches the previous base/level.
I think best to illustrate from a higher level of view shown on my pic. the yellow are better bases, and blue arrows are panic drops. Your bases you drew are ok to use, but I prefer bases with MULTIPLE TESTS. As you can see there were two tests on each of my yellow line. Your entry point (buy) seems wrong and should be on these panics where the blue arrows are, THEN sell close to the base.
The crux of this analysis tho is that these are still small percentage trades like 2-3%. I would take an even higher overview if you want the 10%+ trades.
I know this is isn't coming from Luc himself, but hope this helps
Yes thanks for the input..always helpful!