How to visualize stacked bar charts in R
There are many cases in which visualizing the data in a certain way helps in making comparisons and confrontations in order to understand better the different orders of magnitude that exist between variables. In this context by visualizing your variables in a grouped way it is possible to compare better the variables. For example, if you are selling in a number of cities three different types of products then by grouping the cities by each product it is possible to distinguish better how each product is doing in each city and vice-versa spot the problems in selling a certain type of product in a certain city.
So given the dataset :
City,ProductA,ProductB,ProductC

Paris,23,11,12

Rome,89,6,56

Milan,24,7,13

Dublin,36,34,44

Sofie,3,78,14
The R code in the snippet below explains this in just a few lines where each step is well commented.
However the steps are a) loading the data and b) visualizing it
For this example, we use R library RColorBrewer so install and use it before attempting to run the following R code
sales =  read.csv("C:\Users\Alket\Documents\citysales.csv") // load the dataset

// visualize the graphics

barplot(as.matrix(sales[,2:4]), legend.text=sales$City, args.legend=list(bty="n",horiz=TRUE),

col=brewer.pal(5,"Set1"),border="white",  ylim=c(0,200),ylab="Sales Revenue (1,000's of USD)",main="Sales Figures")
When you execute this code the result is the following:
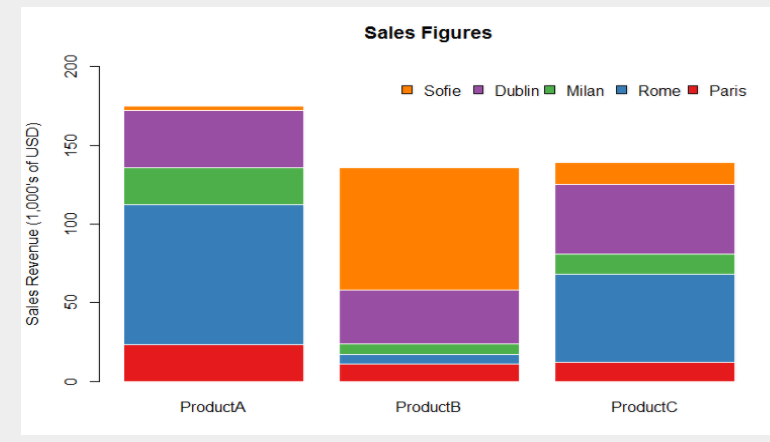
As you can see from the graph it is much easier to spot the differences between product sales in a certain city and or correlate the sales of one product with another.
If you enjoyed this article guide please support datatreemap by upvoting this post. And stay tuned, more guides on data visualization are coming soo.
@datatreemap thank you appeal to @sportic. Your post and will see more than 2K of my followers
You're welcome :-)
Your resteeming service sucks! All your followers are "dead". 2000 followers, 3 upvotes......
@originalworks
The @OriginalWorks bot has determined this post by @datatreemap to be original material and upvoted it!
To call @OriginalWorks, simply reply to any post with @originalworks or !originalworks in your message!
To enter this post into the daily RESTEEM contest, upvote this comment! The user with the most upvotes on their @OriginalWorks comment will win!
For more information, Click Here!
Special thanks to @reggaemuffin for being a supporter! Vote him as a witness to help make Steemit a better place!