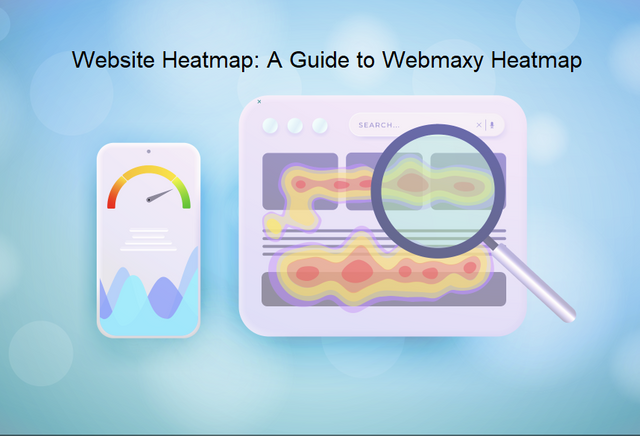
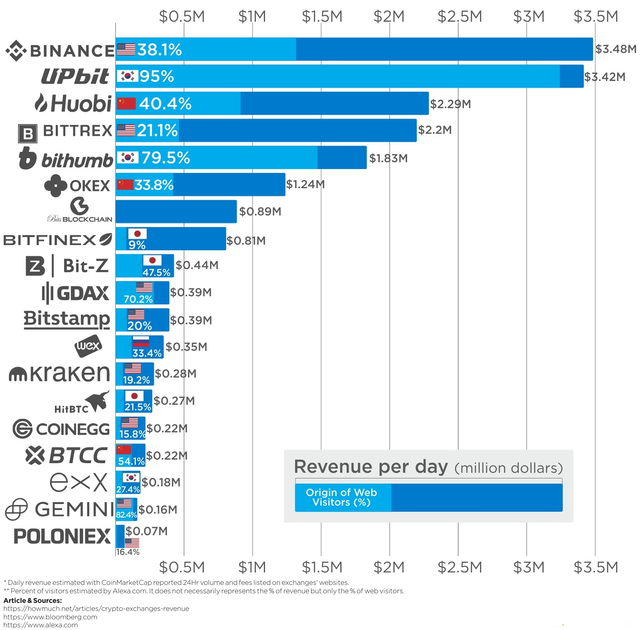
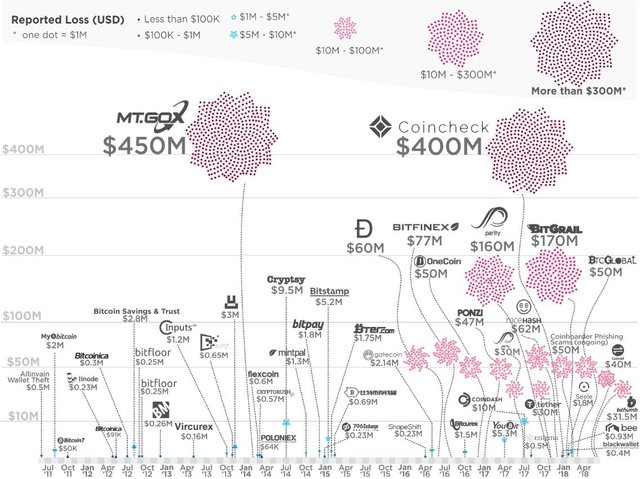
#datavisualizationUnmoderated tagAll postsTrending CommunitiesSteemitCryptoAcademyNewcomers' Communityআমার বাংলা ব্লগKorea • 한국 • KR • KOSTEEM CN/中文Steem AllianceAVLE 일상WORLD OF XPILARSteem POD TeamBeauty of CreativityUkraine on SteemTron Fan ClubExplore Communities...#datavisualizationTrendingHotNewPayoutsMutedamy24 (35)in #data • 2 months agoConvert Your Data into Interactive Visual Stories Using D3.js: A Step-by-Step GuideHave you ever stared at a plain spreadsheet and thought, "There's got to be a better way of telling this story"? I…syntaxtechs (31)in #datavisualization • last yearUnlocking the Power of Data Visualization for Business SuccessIn today's data-driven world, businesses are constantly seeking innovative ways to extract meaningful insights from…syntaxtechs (31)in #businessintelligence • last yearTop Business Intelligence Reporting Tools in 2024: A Comprehensive GuideBusiness Intelligence Reporting Tools have become the backbone of modern enterprises, providing actionable insights…webmaxyofficial (33)in #datavisualization • 2 years agoWebsite Heatmap: A Guide to Webmaxy HeatmapGoogle pioneered the heatmap technology, which is a navigational map to track the user journey on your website.…webmaxyofficial (33)in #datavisualization • 2 years agoHow To Create a Heatmap For Your Website – In 13 StepsHeatmaps are a method of data visualization in which the magnitude of a parameter is shown via color on a…webmaxyofficial (33)in #datavisualization • 2 years agoWhat are website heatmap analytics?What are website heatmap analytics? Website heatmaps are essentially visual representations of how visitors interact…webmaxyofficial (33)in #heatmap • 2 years agoBuild Powerful Heatmaps To Understand How People Use Your SiteAre you struggling to understand what kind of content you should produce to attract your target audience, engage with…nadeemsalam (28)in #datascience • 3 years agoWhy is Data Science a Need for Startups?Both the highly developed and startups search for easy-to-use technologies that they can use in their daily operations…samkir (25)in #datascrapingservices • 3 years agoTop 5 Data Extraction Tools in 2021 - Web & Data scraping Tools:#Saivi is a comprehensive offering that covers end-to-end data-related services that can help you all the way from…technovids (25)in #powerbi • 3 years agosteemCreated with Sketch.ONlLINE POWER BI COURSE | TECHNOVIDSMicrosoft Power BI course is designed for Microsoft Excel power users those who are ever trying to dig out insights…shozab (25)in #saas • 3 years agoUsing SAAS is The Smart Way to Operating BusinessesSoftware as a service (SaaS) has become the most popular way for small businesses to operate. It has many benefits…refugeestudio (27)in #coronavirus • 5 years agoJavaScript Data Visualization: Coronavirus data with D3 — PieI love data visualization because it is a wonderful tool to communicate what you have found in that data with the…lewischou (8)in #datavisualization • 5 years agoHow to Implement Data Visualization for Large Screen?1. What is data visualization? In the era of big data, visual dashboards have become an important tool for business…lewischou (8)in #datavisualization • 5 years agoCompare Top 14 Data Visualization Tools of 2019What are the best data visualization tools? Well, that’s a tricky question, because there are so many different…the.curator (62)in #dataforstorytelling • 6 years agoThe Curator's Feed : 2019/07/22 12:37:14#dataforstorytelling #datavisualization How to Power Marketing Presentations With Data Visualization & Win Over Your…exgap (54)in #microsoftexcel • 6 years agoMicrosoft Excel's AI tool for data visualizationA nicely featured AI-powered visualization tool called Excel Ideas can help extract the essential information from a…exgap (54)in #datavisualization • 6 years agoDaily profit distribution amongst cryptocurrency exchangesIf we take into count that the crypto market exists merely 10 years, daily profits that they generate according to…exgap (54)in #datavisualization • 6 years agoAll cryptocurrency hacks in one graphSecurity of decentralized cryptocurrencies is a huge topic. Some say that investing in it for an ordinary person has…datavizcat (30)in #dataviz • 6 years agoChart Combinations with Arc DiagramsHere’s a list of different charts that can be combined with an Arc Diagram to display additional data.exgap (54)in #datavisualization • 6 years agoData visualization of the crypto market for 2018Happy New Year to all steemers, let's start the channel with some optimistic view on the crypto world in general with…