You are viewing a single comment's thread from:
RE: Bitcoin (BTC) Evening Update: Awareness of Probable Price Pathways Keeps the Panic AWAY!!
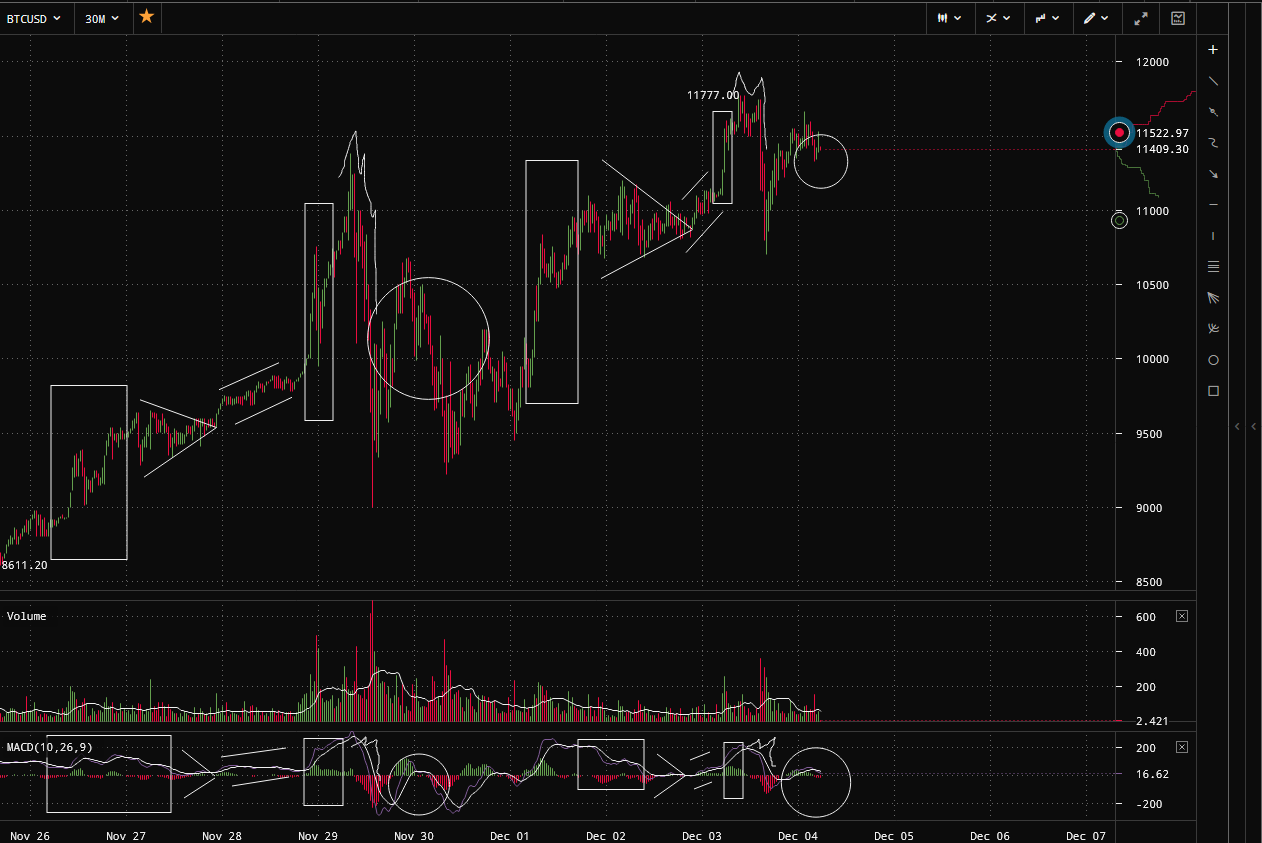
Still looks like it could be a valid fractal follow through.....macd also.....

Still looks like it could be a valid fractal follow through.....macd also.....

so would you assume the probability that the correction is in the C wave working towards the terminal end? How many waves can be in the C wave, it should be 5 right?
If this is the price pathway and once we count 5 waves, it should be nearing the terminal end of C. I'm thinking out loud so any feedback would be greatly appreciated
The wave can have multiple counts. I count the chart as it stands a little differently than haejin's primary count. My count is much more similar to his alternate count presented here.
Personally, I do think the "circle" part of the fractal will be the terminal end....but the time crunch is really hard to say....in the first circle you had a span of two days where price hung in that area. However, from what I study in chart fractals and how they tend to invert or alternate, in this case, it alternates in speed and density. The density is smaller in this fractal, which could lend to a more speedy bounce back up...which wouldn't leave time to make a buying decision. But when fractals are repeated in a different speed and shape...that is as good as a guess...it could flip upward as soon as it hits. If it plays out exactly as a repeat, it could still waiver for a day or so up and down before trending back up.
Fractal changes are hard enough to point out on a blog post when they vary in shape (warped) like here....much less explain all the possible moves from this point to the next. The dots on the right are my short and long position setups for this fractal....as you can see, I'm confident in the repeat with a long buy set at 10934....which I think is playing it safe to make sure it hits.....I think prices will go closer to 10800, but risking that price depth is not worth it when shorting at such a high price with such a small difference price (relatively).
Well thanks for taking the time to answer. It makes me realise I still have a whole helluva lot to learn!
Hey, me too. I never rely on just seeing fractals to make a guess where it's headed. If the count doesn't look right, it probably isn't...and thus the change is unpredictable. Really, you can find fractals all over charts....they just don't always trend the same way. Things went well this time, but everything lined up just right, including my EW count.
That path looks possible. I think we still have another swing upward before the larger correction though. Good video, thanks for supporting Haejin's blog!