Stellar Lumen (XLM) & IBM?

SUMMARY
On BitcoinLive; daily Crypto updates are made available while also, on demand analysis requests are fast filled. Join us as we have now opened up monthly and quarterly subscriptions. Use this link: https://bitcoin.live?aid=110. Below is an excerpt of a recent Bitcoin (BTC) cycle analysis.

Legal Disclaimer: I am not a financial advisor nor is any content in this article presented as financial advice. The information provided in this blog post and any other posts that I make and any accompanying material is for informational purposes only. It should not be considered financial or investment advice of any kind. One should consult with a financial or investment professional to determine what may be best for your individual needs. Plain English: This is only my opinion, make of it what you wish. What does this mean? It means it's not advice nor recommendation to either buy or sell anything! It's only meant for use as informative or entertainment purposes.
Not so sure about what you've just said because I think it is mostly tied to bitcoin. I'm also not sure the whole thing isn't being manipulated...
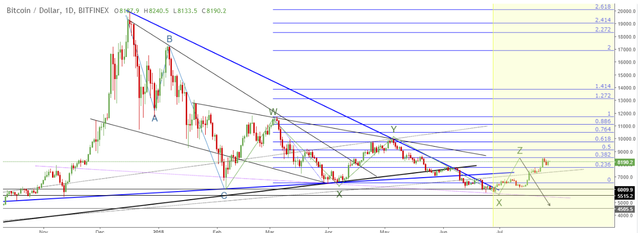
I think you are incorrect. The chart pattern is similar to that of Bitcoin. These are my labelings for Bitcoin and as you can see the price has just interacted with my projected Z wave, which is why I am expecting more downside from here:

It's good to see your solo EW analysis. The first ABC should be the W; where you have your W should be an X; where your X is should be Y; your Y should be X and you last X should be Z. So, it would men the WXYXZ is complete. Your call for lower low is a valid scenario.
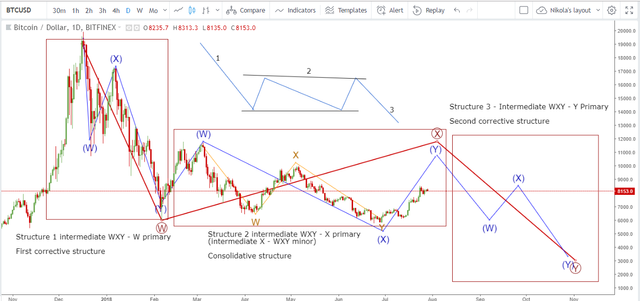
Dear @haejin thank you for your feedback, but I would have to disagree and would like to further discuss this with you. I have labeled my chart again as to simplify my takeaway. Take a look:

As you suggested the first structure is a W wave, and that is true in my mind but not as incorporated with the waves from the second structure that is consolidative in nature. The first structure should be viewed as one whole and not be mixed with the second one. The second structure can be either a WXYXZ (my primary count) or another intermediate WXY in which another minor WXY is incorporated (alternative count).
Current wave high will determine the validity of my count - if the price decreases from here then my WXYXZ count is in play, and if it increased (up to 12000$ max which is the high from the second intermediate W wave) then the alternative count is in play.
In both scenarios, I am expecting the price of Bitcoin to go significantly lower as Structure 3 will occur as a trend continuation after some period of consolidation.
Stellar Lumen is showing a similar pattern to Bitcoin and so are other cryptos as the market is strongly correlated, which is why I think your XLM count is unlikely.
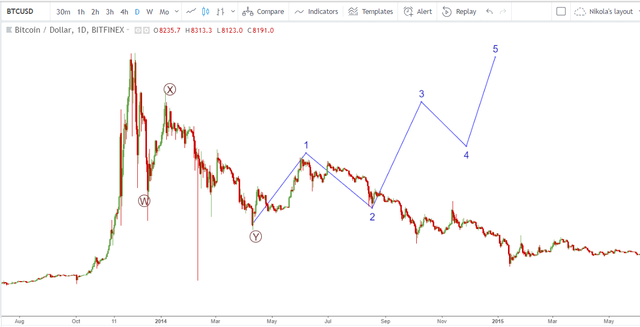
Similar correction happened in 2014 and I have labeled the equivalent prices to the current once.
The price of Bitcoin retraced back to the levels from which the all-time high was made as the wave Y ended which would today be 3000$ or less to 2700$.
You view is rather a simplistic one: motive - correction-motive. Applied on the Bitcoin chart from the 2014 correction it would look something like this:

Hello Haejin, can you please take a look at TGN 'Tungsten' Mining. It's stock on the ASX. I'm trying to pinpoint if it's wave 4 right now or if we are in an ABC correction already.
Thankyou!
Hi, this chart and post will be available tomorrow on steemit:

Stellar is going up after the news is out that IBM is going to use ita platform for their innovations. Though stellar has great potential and ibm news will give it more spike. Our crypto market is also depend upon such news and hope to see some positive movement in the market.
Posted using Partiko Android
nice man looking for positive changes
what an amazing place this is!! just speechless
Hey bro you are a crypto experts.....?
Thank you for your visiting my posting.^^
Extra
Allow me to resteem this post and let everyone see it.