ETHER (ETH) SHOWING WEAKNESS IN THE CHART - HEAD AND SHOULDERS FORMING AS WE SPEAK - SEE CHART

Hi guys and gals,
Quick ETH update.
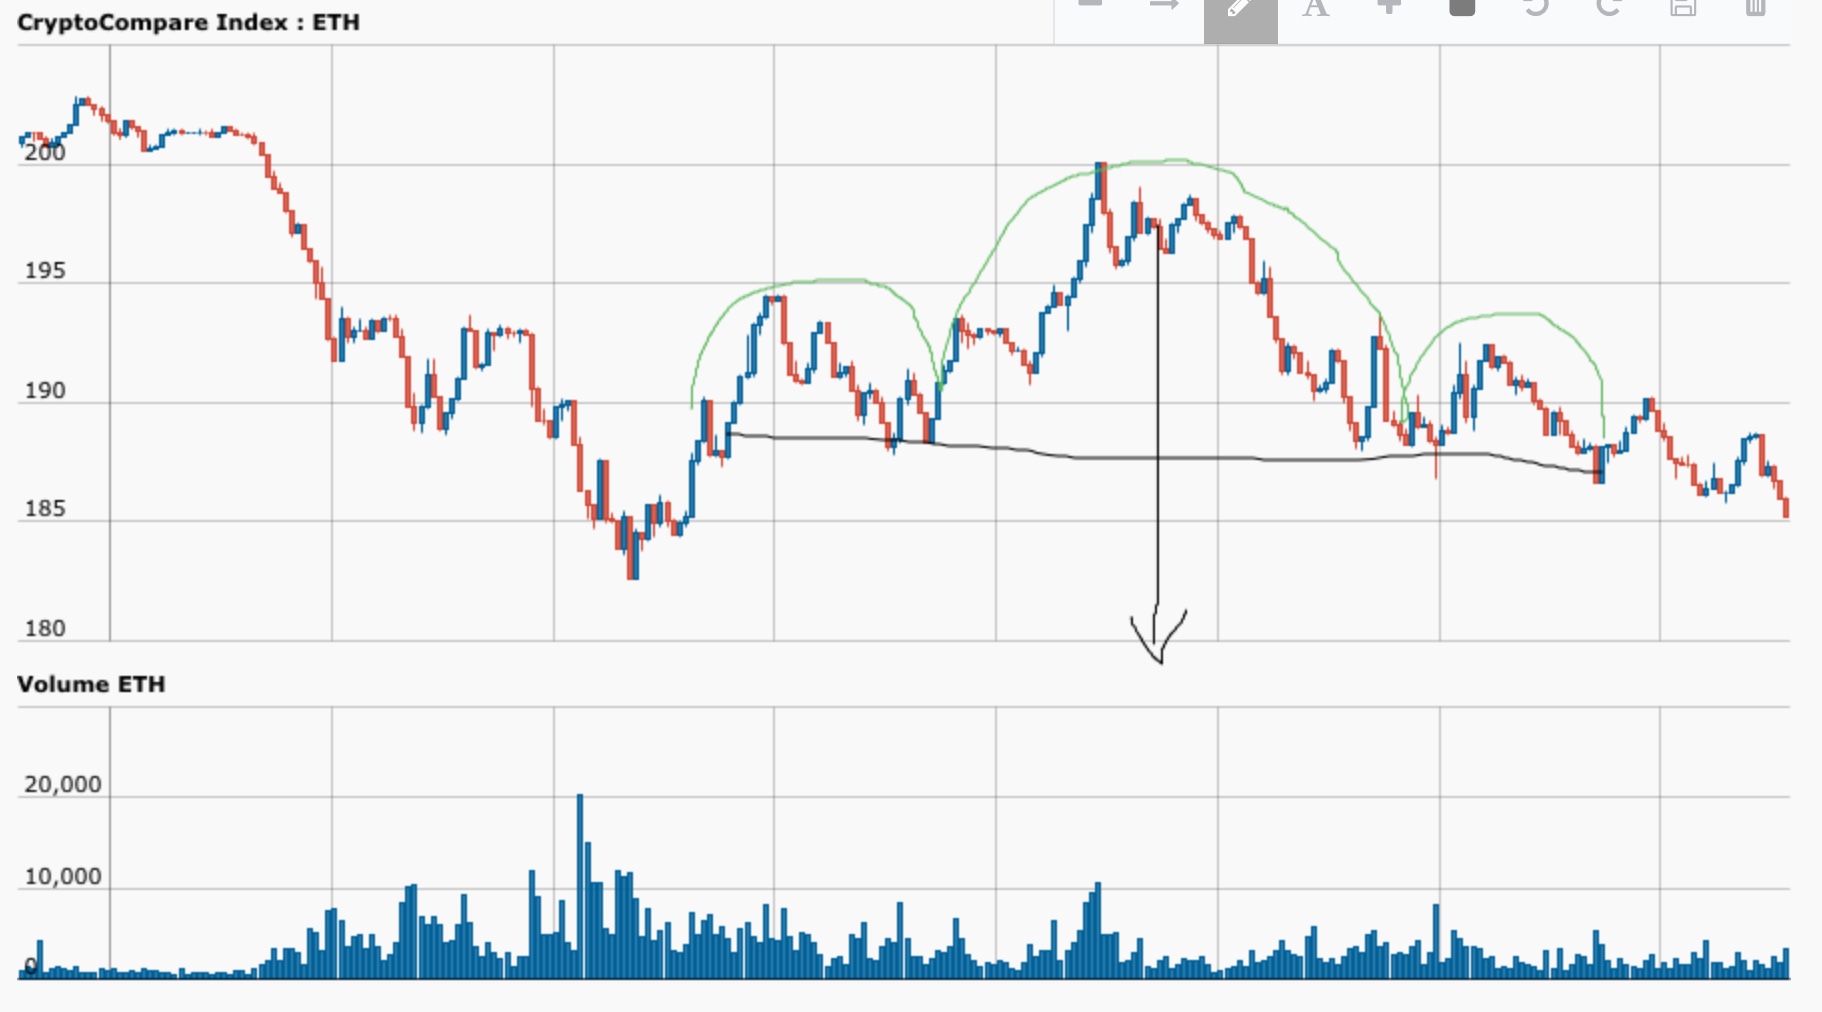
The ETH daily chart is completing a head and shoulders pattern. This signals weakness and thus the potential of another move to the down-side.
Wait for it and BUY on the way down my friends. This time of volatility will pass and we will soon enter a next BULL market. When that happens you will be happy that you bought! :)
The chart signals that we could even have a drop to the $160 levels... Let's wait and see...
Let me know below what your thoughts are.
Have a great day and whatever you do... HODL,
Agreed, let it drop and take advantage.
Absolutely! And... here we are at $160 ;)
@Ozz