Steem Tags' Covariance, Graphed
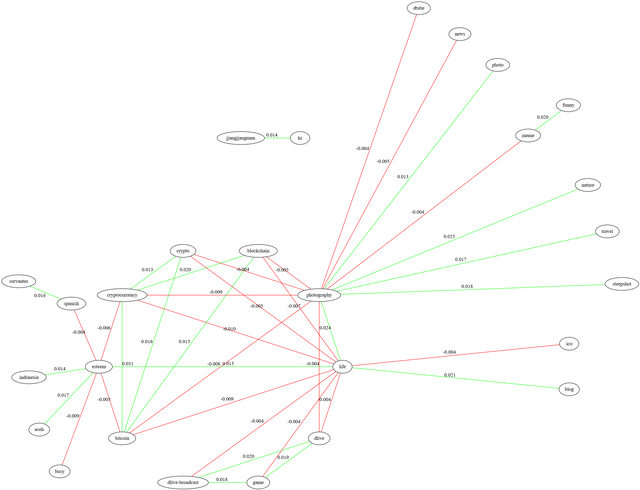
As a follow up to the discussion from a couple days ago (https://steemit.com/mathematics/@markgritter/steem-tag-covariance) I though I'd try graphing the highest-value relationships between Steem tags. Here are the top 20 covariances and bottom 20 covariances:
Green lines are positive covariance; i.e., tags that are more likely to appear together. Red lines are negative covariance; tags that are less likely to be used on the same discussion.
The graph may be a little misleading in that it suggests there isn't significant covariance where a line isn't drawn. But, for example, "bitcoin" and "crypto" have covariance 0.007, which is pretty strong! But not in the top 20.
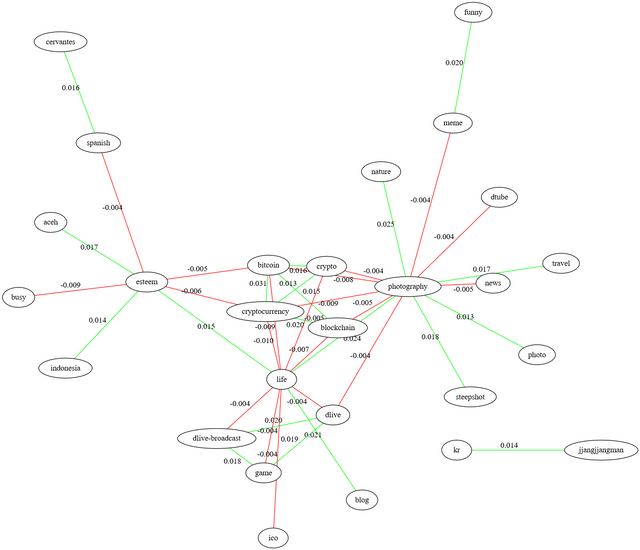
An alternate layout, using 'circo' instead of 'sfdp':