crypto analysis
BTC didn’t manage to rise above the C limit we set yesterday, and so we have to make peace with the idea of a decreasing ABC wave which will decrease our profits. The pink ABC wave is this decrease’s result which still did not end but since a support level is visible I believe that things will take a turn which will include an increasing ABC wave reaching about 15400 $.
The dotted line shows not only the ABC wave but also other Elliot options that might end our turn.
Let’s take a look at the brown support level line we can see that we reached under it which showed a good probability to start rising along with the blue line wave. This might still happen though we should probably be worried about the red support level which draws a decreasing triangular shape with our decreasing trendline. This might even be a possible further decrease meaning that we might need our reserve funds in case we want to buy BTC.

https://www.tradingview.com/chart/BTCUSDT/jZgTKEVr-BTC-USDT-Elliott-waves/
https://www.tradingview.com/x/RxiuYpsn/
I could open by saying thank God for BTC, otherwise the altcoins would be bored. This would be a reflection of the current situation because we can clearly see that while BTC was “sleeping” everybody did his job but now altcoins have it pretty hard. We can see that we’ve risen 3 waves toward the 1450$ level when the Bitcoin pirates managed to steal our profits, this is what we have to get back before reaching the 2nd level otherwise we can most definitely say goodbye!
https://www.tradingview.com/x/pZqrqqWW/
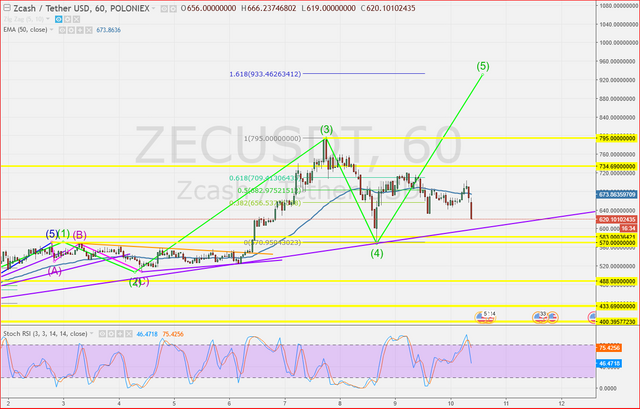
If we talk about ZEC the nr. 5 green line should show a growth but currently things do not stand this way. We shouldn’t even talk about what this movement follows but hopefully the rising trendline will be the barrier for this decreasing movement.

https://www.tradingview.com/x/rzbFmBg0/
When it comes to DASH, yesterday a resistance took place at about 1128$, if this would have taken place after the correction we could have made pretty good profits. Currently prices are falling showing 1020$ and a 0.61 fibo level showing that this would still be acceptable for a rising wave but under this level I would be very cautious in awaiting for a rising wave.

https://www.tradingview.com/x/FtIAAgo9/
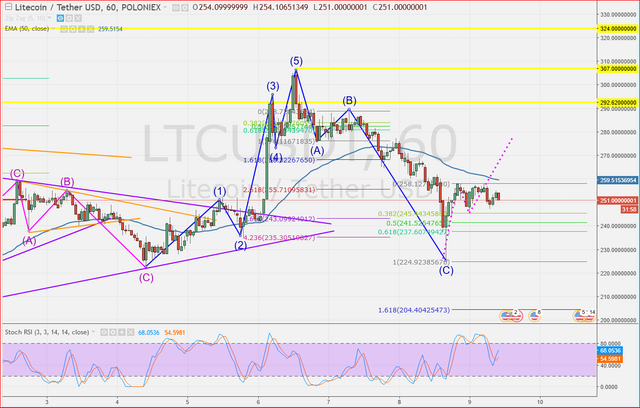
LTC- Sadly the triangular shape had a pretty rough job during this decreasing trendline and as you can see it didn’t really manage to show any production. What you can currently see is the ABC wave’s crossing of C level resulting in a 5 wave Elliott impulse causing a -200$ closing.

https://www.tradingview.com/x/rWPoKyyj/
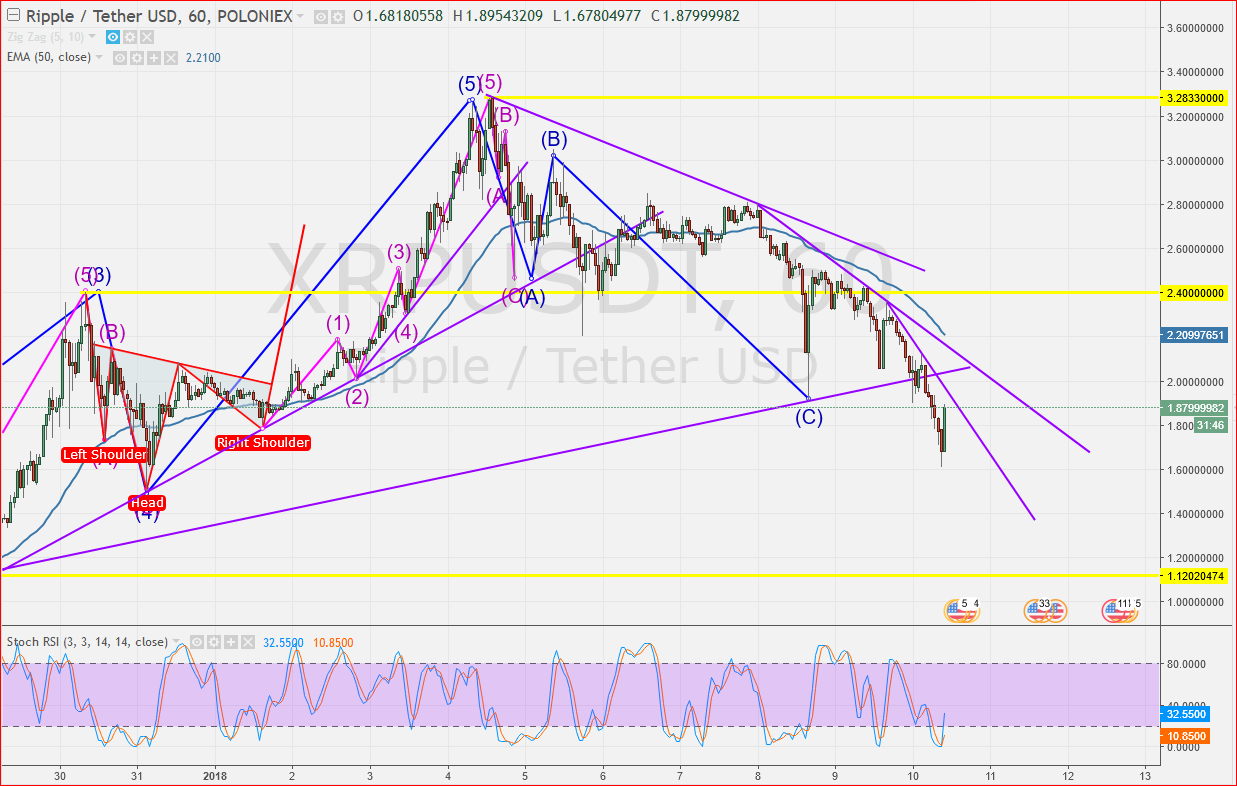
The biggest problem with XRP is that those who invested last time in the coin causing it’s growth didn’t really look at what is actually good for this coin but rather it was a try in “destroying” BTC so to say, but it’s still not clear whether the banks will give it another shot or leave it as it is. For now, the charts show us full chaos nothing is seems clear not even the current direction , apparently the prices seem to be dropping but this does not coincide with the Elliott wave and for an ABC wave it is starting to be pretty irregular. I personally think that it is too risky and would not recommend buying at this point.

https://www.tradingview.com/x/lzjdk3Hr/
Thanks so much for reading! Don't forget to check out the original article.
https://steemit.com/crypto/@cryptoparaszt/picike-poloniex-koerkep-01-10