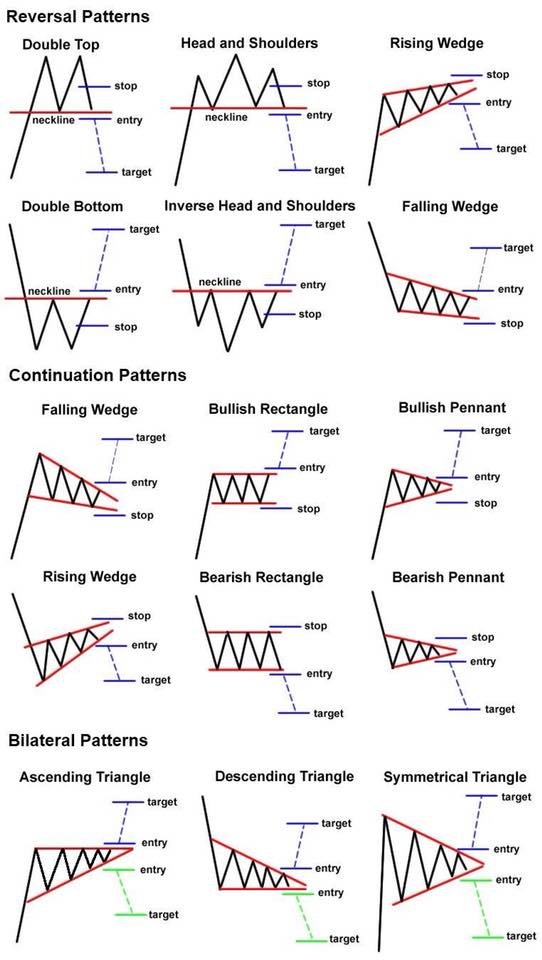
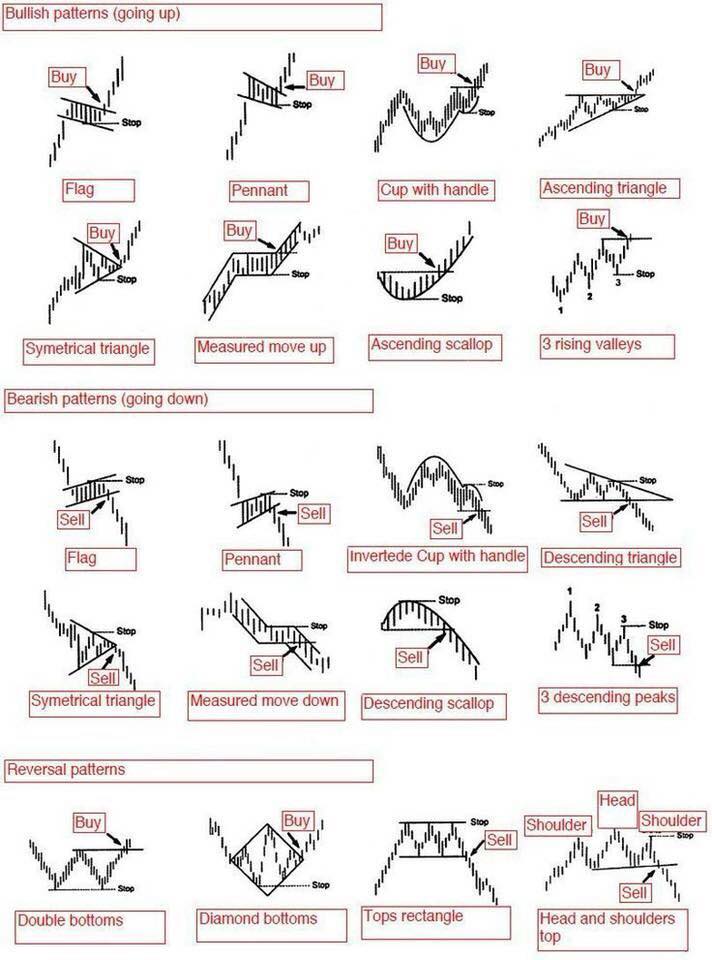
Learn to read trading charts if market is bullish or bearish
Glossary
Bearish: An asset is bearish if the price is set to fall according to certain indicators or rules, or a person is bearish if he thinks that the price of an asset will decline.
Bullish: An asset is bullish if the price is set to rise according to certain indicators or rules, or a person is bullish if he thinks that the price of an asset will rise.
Chart: The most common way of describing the price history of a financial asset. There are several types of charts like Line, Candlestick, Bar, Point and Figure… All have their strength and weaknesses and can serve different purposes in the analysis.
Currency Pair: The unit of currency trades, consists of the ratio of two currencies, usually described with the three letter abbreviation of the currencies like EUR/USD (Euro/US Dollar).
DAX: The stock index of the 30 biggest German listed companies. Capitalization weighted index.
DOW Industrial Average: The stock index of the 30 biggest US listed companies by market value. Price weighted index, so a less reliable measure of performance than its capitalization weighted peers.
Exchange Traded Funds (ETFs): Stock-like assets that follow different indices, assets, currencies, bonds, and other prices or values. Usually traded on stock exchanges with low commissions providing passive and cheap alternatives to mutual funds.
Financial Leverage or Leverage: The level of exposure to a financial asset, also used to describe an exposure that is larger than the investors capital. As an example having a $100,000 position when the investor has $10,000 capital is a leverage of 10:1.
Forex: Foreign Exchange. The market for currencies that is decentralized, consists of various market centers, and that has the highest transaction volume of every financial market.
Fundamental Analysis: An analysis method to determine the value of an asset by judging its markets, supply-demand conditions, the trends affecting the asset, and the financial, management, and competitive situation of the company in the case of stocks.
Futures: Derivative contracts originally used to buy and sell commodities at a certain future time. Nowadays also used for leveraged speculation in various asset classes.
Hedge Funds: Investment Funds that are free to invest in financial assets, without restrictions in shorting, leverage, or other risk measures.
Long Position: Holding an asset or having any other position that benefits from a rise in the price of the asset (call option or other derivatives for example)
MACD Indicator: Moving Average Convergence Divergence. One of the most used momentum indicator, good for judging in what phase of the trend an asset is
Momentum: The general direction of an asset together with the strength of the move in that direction.
Moving Averages: Trend indicators calculated by different methods from the price history of an asset. The direction of the MA describes the trend on a certain time-frame, while the position of the different MAs can be used to identify trend changes.
Mutual Funds: Traditionally managed stock portfolios that can be bought on exchanges or outside exchanges. Usually apply hefty fees, with the average fund underperforming stock indices o n the long run.
NASDAQ 100: The stock index of the 100 biggest NASDAQ listed companies (mostly technological stocks). Capitalization weighted index.
Oversold/Overbought Readings: An indicator is in the zone where previous bottoms/tops occurred, always relative terms and not trading signals in themselves
Relative Strength Index (RSI): The most popular momentum indicator, that can be used with different parameters to judge the short- or long-term momentum phase of a trend. Its values range from 0-100 with a reading above 70 usually associated with an overbought position, with a reading below 30 being oversold and between 30-70 being neutral.
Resistance: A level of increased supply of an asset, that usually stops an advance until the increased supply is exhausted or the trend reverses. A possible entry point for longs and an exit point from short positions.
S&P 500: The stock index of the 500 biggest US listed companies by market value. Capitalization weighted index.
Short Position: Short selling an asset or having any other position that benefits from a decline in the price of the asset (put option or other derivatives for example)
Stochastic Oscillator: A momentum indicator that is usually used to identify short time tops and bottoms using overbought and oversold thresholds.
Stock Index: An average of stock prices that shows the general direction of the market or a segment of the market. It can be calculated in several ways, but the most informative indices are the capitalization weighted ones. Those take the size of the stocks into account when averaging the prices.
Stocks, Shares, Equities: Financial assets that represent the ownership of a company or a set of companies (ETFs). The most common financial assets.
Support: A level of increased demand for an asset, that usually stops the decline until the increased supply s exhausted or the trend reverses. A possible entry point for shorts and an exit point from long positions.
Technical Analysis: The analysis of the price history of financial assets. Its goal is to judge the most likely route of future prices by determining the trend the trend phases, analyzing price patterns, and different indicators. A probabilistic analysis method.
Trading Range: A zone between a support and a resistance level where the price is “trapped” for a longer period of time.
Trend Channel: A rising or declining price range that consists of a supporting trendline and a resistance trendline that describes the underlying trend’s path higher or lower.
Trend: The general direction of the price movement of an asset. Can be short- or long-term phenomena. Trading in the direction of the trend is one of the most important rules.
Trendline: A resistance or support level with an angle that describes the strength of the underlying trend, it can be rising or declining.
Volatility Index (VIX): A measure of the daily volatility (implied in options) that investors expect for the stocks of the S&P 500. Also referred to as the Fear Index.
Volatility: The measure describing the average change of the price of an asset in a certain period. It can be calculated in all time frames, but the daily volatility is the most used.