You are viewing a single comment's thread from:
RE: VIACOIN (VIA) Just BUSTED OUT of a Downward Wedge!!
since my reputation has been damaged during the flag war, i cant upload any pictures :-(
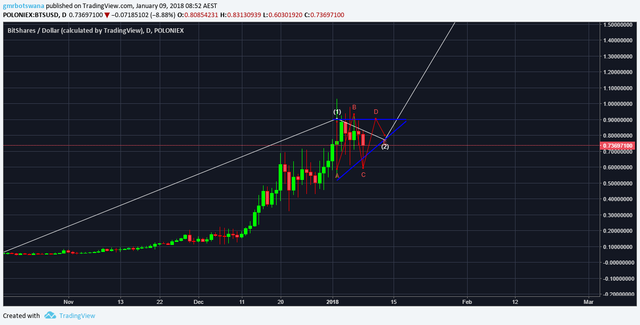
But i count ABCDE waves finished for BTS with a small break out going on also..!
I looked at the poloniex/BTC chart.
Lets hope im right!
Hopefully the upvote will help your reputation a bit. Do your counts on the daily chart and not the lower time frame charts. It will give you a better picture. I for one would be very happy if your count is correct. I dont mind being wrong, when the price is going up.
Thank you very much, thats very kind of you!
And you are rigth, as long as we go up...there will be only smiling faces rigth?!
Time will tell if i was rigth ;-)
Btw, i did on 15 min chart. from 1st of januari until today...if i would use daily chart i dont see enough details!
The problem on the 15min chart is you see to many details and it confuses the situation, which is why I recommend doing your counts on the daily chart. Then use the lower time frame charts to count the subwaves within your Daily time frame charts to confirm that they are correct.
Thank you for your advice, appreciated!
BTS on the daily chart
[img] [/img]
The earlier triangle would be a good fractal.