Steemit Business Intelligence: How SBD Price Movement is Changing Payout Preference
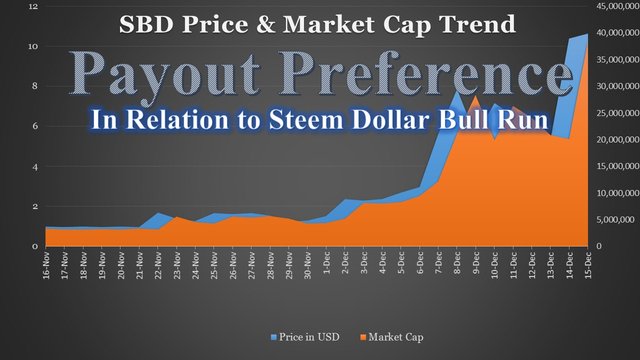
In this recent contribution I analyzed the change in trading behavior brought about by the movement in Steem Dollar price. I used the same chart below to show the inflection point in the Steem Dollar price somewhere in the beginning of December.
Delimitation
This will be a comparative analysis on the payout preference selection of content creators between November 21-30 (10 Days) before Steem Dollar price picked up momentum, and December 1-10 (10 Days) when the upward movement of Steem Dollar price happened. I wanted to do a 15 days comparison, but the published works from December 14 have not been paid out at the time of the analysis.
This analysis will only cover the payout selection on posts and will exclude comments. I used arcange's Steem SQL Public Database to acquire the data-points related payout selection in the VOAuthorRewards table.
Methodology
To get the data related to payout selection distribution, the actual rewards in Steem Dollar, and the top rewarded authors in Steem Dollars between the period of November 21-30 and December 1-10 by running the below SQL Queries:
SELECT *
FROM VOAuthorRewards (NOLOCK)
WHERE timestamp>= CONVERT(datetime,'11/24/2017')
AND timestamp< CONVERT(datetime,'12/1/2017')
SELECT *
FROM VOAuthorRewards (NOLOCK)
WHERE timestamp>= CONVERT(datetime,'12/1/2017')
AND timestamp< CONVERT(datetime,'12/11/2017')
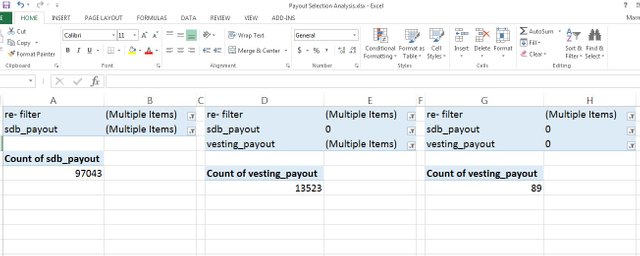
I removed the comments by running the =RIGHT(Text,Number of Characters) formula in excel and filtered out the result beginning with re-.
I then plotted the data-points in an excel spreadsheet to create the charts and visually present the data.
The Analysis
Before & After Payout Preference Distribution
The next two charts will show the preferential distribution of payout selection made by content creators in the two periods being compared.
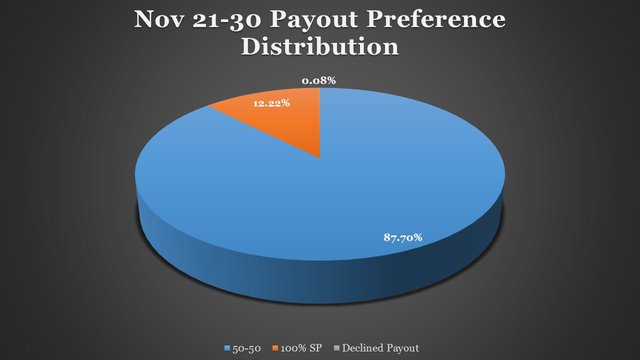
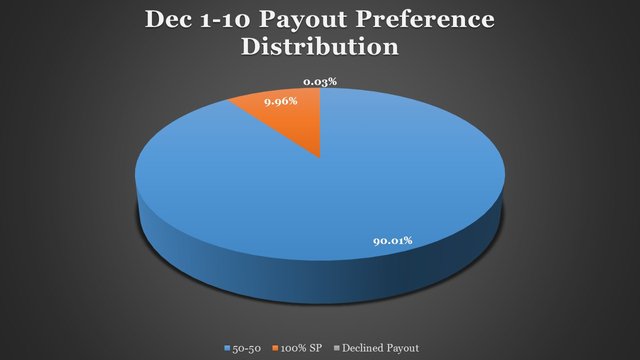
There is a considerable change in the payout type selection behavior from 100% to 50-50 between the two periods being compared, from 12.22% (100% SP) on November 21-30 the number of power up posts went down to less than 10% on December 1-10. I was also expecting more active posting on the December 1-10 period, but the data said otherwise. Here are the data-points used in the charts in a table:
| Period | Payout Selection | Post Count | % Distribution |
|---|---|---|---|
| Nov 21-30 | 50-50 | 97043 | 87.70% |
| Nov 21-30 | 100% SP | 13523 | 12.22% |
| Nov 21-30 | Declined Payout | 89 | 0.08% |
| Dec 1-10 | 50-50 | 98051 | 90.01% |
| Dec 1-10 | 100% SP | 10854 | 9.96% |
| Dec 1-10 | Declined Payout | 31 | 0.03% |
The data returned a slightly lower number (-1719) of post for the December 1-10 period when compared to the November 21-30. It may be taking time for the recent price movement to affect the change in actively posting, but it is for sure already changing the payout selection decision.
30 Day Payout Preference Trend
In this chart I wanted to present a full 30 days trend of distribution of payout preference. This covers the period of November 21 to December 20. Here it can be seen that from a starting point of as high as 14% of posts 100% powered up at the beginning of the period being analyzed, it has continuously gone down to as low as 5% at the end of the period.
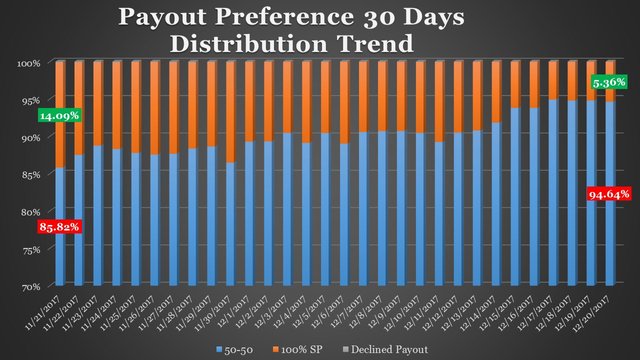
Here is the data shown in a table:
| Date | 50-50 | 100% SP | Declined Payout |
|---|---|---|---|
| 11/21/2017 | 9443 | 1550 | 10 |
| 11/22/2017 | 9315 | 1319 | 10 |
| 11/23/2017 | 9552 | 1202 | 8 |
| 11/24/2017 | 9828 | 1289 | 12 |
| 11/25/2017 | 9490 | 1315 | 6 |
| 11/26/2017 | 9376 | 1329 | 4 |
| 11/27/2017 | 9979 | 1395 | 10 |
| 11/28/2017 | 9878 | 1289 | 11 |
| 11/29/2017 | 10004 | 1274 | 8 |
| 11/30/2017 | 9690 | 1505 | 10 |
| 12/1/2017 | 9477 | 1134 | 3 |
| 12/2/2017 | 8293 | 991 | 1 |
| 12/3/2017 | 9008 | 948 | 1 |
| 12/4/2017 | 9967 | 1217 | 0 |
| 12/5/2017 | 10198 | 1073 | 5 |
| 12/6/2017 | 10841 | 1335 | 3 |
| 12/7/2017 | 10578 | 1097 | 3 |
| 12/8/2017 | 9887 | 1011 | 4 |
| 12/9/2017 | 9757 | 994 | 5 |
| 12/10/2017 | 10045 | 1054 | 6 |
| 12/11/2017 | 9523 | 1141 | 7 |
| 12/12/2017 | 9923 | 1040 | 1 |
| 12/13/2017 | 10635 | 1078 | 2 |
| 12/14/2017 | 10627 | 944 | 1 |
| 12/15/2017 | 11307 | 746 | 1 |
| 12/16/2017 | 11405 | 751 | 1 |
| 12/17/2017 | 11951 | 638 | 1 |
| 12/18/2017 | 12475 | 685 | 1 |
| 12/19/2017 | 13174 | 724 | 0 |
| 12/20/2017 | 2878 | 163 | 0 |
The data for 12/20/2017 (today) is partial. This data is being presented for the purpose of showing the distribution between the preference on payout. If the current price of Steem Dollar is kept to where it is currently (my hope is that it goes even higher), this selection behavior is likely to continue to trend towards less and less content creators choosing the 100% SP option.
Top Steem Dollar Earners
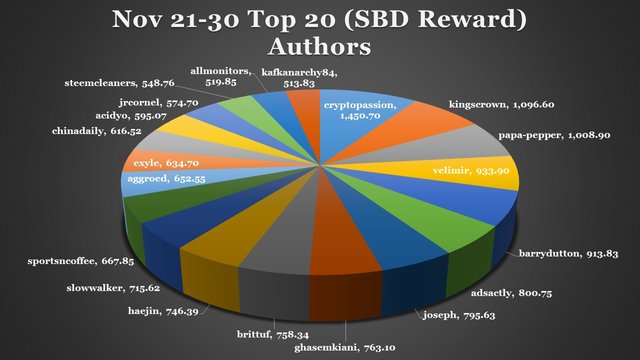
I also wanted to look at the data of Steem Dollar reward distribution per Author between the two periods. The chart below shows the Top 20 Authors who were rewarded with the most number of Steem Dollars for the November 21-30 period. There was a total of 157,671 Steem Dollar reward for this period, and 15,308 (9.68%) went to the top 0.11% authors (20/17,654)
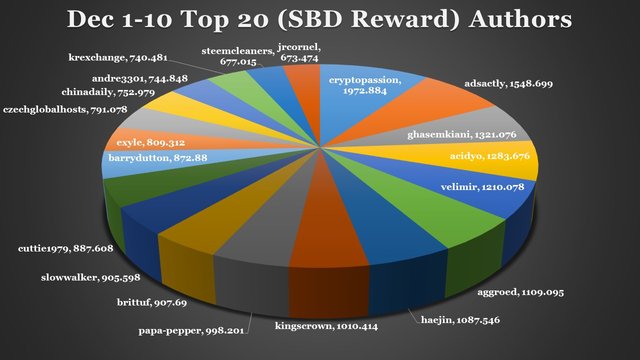
For December 1-10 period, there was an increase of total Steem Dollar rewards by 57,151 Steem Dollar, getting the total Steem Dollar reward to 214,823. In terms of distribution the top 20/17053 (0.12%) authors got the sum of 20,305 (9.45%)
Conclusion
There's a number of changes in the behavior patterns of Steemians with the recent movement in Steem and Steem Dollar prices. One of those changes was earlier highlighted in this recent contribution where the trading behavior changes were analyze.
This analysis shows us how Steemians are making decisions in payout selection. A great majority chooses the 50-50 rewards, and the distribution of authors making this selection increases when the Steem Dollar price is high.
Taking the closing price of Steem Dollar at the end of the periods being compared (November 30, and December 10) Steemians in total made some $205,640 in the 10 days period of November 21-30, then $1,538,129 the following 10 days between December 1-10. The recent price movement is making a lot of difference to many Steemians specially those who's been active in the platform since Steem was priced at $0.07. I believe this to be only the beginning. I feel great about the decision to continuously power up. With an upvote worth $.60, Steem Dollar priced at $10, and Steem Priced at $3; I am able to give a value of $2.33 for Authors choosing 50-50 reward payout. Where I am, this is an equivalent of 117 PHP which can pay for a decent meal.
This is not only an exciting time for all of us Steemians, this is also a really good time to campaign for growing the user-base and share the currency of love.
Posted on Utopian.io - Rewarding Open Source Contributors
Being new to steemit I really wanted to read through this to understand the domain, and use case for steemit and the novel proposal of paying in crypto. But this was way too long of a post. My recommendation a simpler more compact explanation for us neophytes.
Cheers from Costa Rica
LOL! I know what you mean. Felt the same way when I was new. I wanted to learn about Steem and Steemit quickly, but found that a quick and very easy way does not exist. There's just so much to learn. Five months into my journey I am still learning to be honest. I suggest starting with the Welcome section and do read topics that interests you the most one article at a time. Thank you though for taking interest to learn. For that you get a 100% upvote.
Hey @steemitph I am @utopian-io. I have just upvoted you!
Achievements
Community-Driven Witness!
I am the first and only Steem Community-Driven Witness. Participate on Discord. Lets GROW TOGETHER!
Up-vote this comment to grow my power and help Open Source contributions like this one. Want to chat? Join me on Discord https://discord.gg/Pc8HG9x
Congratulations! This post has been upvoted from the communal account, @minnowsupport, by steemitph from the Minnow Support Project. It's a witness project run by aggroed, ausbitbank, teamsteem, theprophet0, someguy123, neoxian, followbtcnews/crimsonclad, and netuoso. The goal is to help Steemit grow by supporting Minnows and creating a social network. Please find us in the Peace, Abundance, and Liberty Network (PALnet) Discord Channel. It's a completely public and open space to all members of the Steemit community who voluntarily choose to be there.
If you would like to delegate to the Minnow Support Project you can do so by clicking on the following links: 50SP, 100SP, 250SP, 500SP, 1000SP, 5000SP. Be sure to leave at least 50SP undelegated on your account.
Your contribution cannot be approved yet because it is not as informative as other contributions. See the Utopian Rules. Please edit your contribution and add try to improve the length and detail of your contribution (or add more images/mockups/screenshots), to reapply for approval.
Hi @steemitph
I'm afraid there is not currently enough here to warrant approval. The main focus of the subimission is to say that the 50/50 - 100% power-up choice has changed about 4%.
This is not really enough information to give, and therefore lacks analysis. Could you add some more information for the timeframe you used?
Thanks
@abh12345
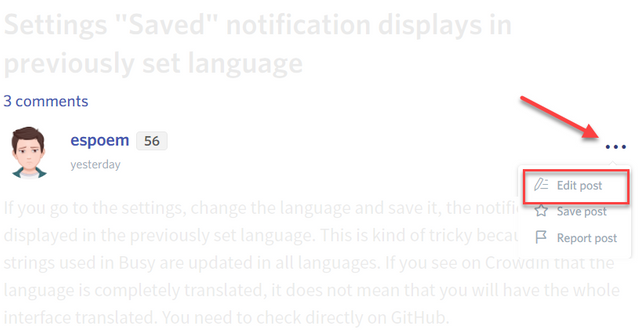
You may edit your post here, as shown below:
You can contact us on Discord.
[utopian-moderator]
Hi @abh12345, I love it that we are becoming more critical of the contributions in the analysis category. I can already think of data-points to add to show the changing behavior pattern. I will work on that as soon as I am freed up from my day job. Thanks again for taking a look.
Thanks for your understand @steemitph.
This is for the good of @utopian-io in the long run.
Have a nice day :)
I have edited this to add a chart showing a trend of gradual change in payout preference for a 30 day period. Please let me know if this now meets the new standard.
Hi @stemitph
The gradual change chart works much better than the pie charts thank you.
For the future of this analysis type, as we have 20 months data, a longer comparision would be much better.
This could be then compared to the changes in Steem price over the analysed period, or the implementation of Hard Forks.
I have approved the contribution.
Thank you.
Hey @abh12345, I appreciate that. As I mentioned earlier I like and support the new (more critical) rules. That will require us to keep improving the level of data we present to the analysis category of utopian. Thank you most specially for the tips.