STEEMIT 2017 Round UP – Analysing the ‘Life’ Category
There are many categories available on Steemit under which you can publish a post. Consistently in the top 10 categories is Life. Being such a popular category to post in, I felt it was important to document the data for this category in 2017
Categories are set by the 'Tags' you select when publishing a post. The first 'Tag' that you select is the Category the post will be recorded in. Once a post has been published on the Steemit platform, tags can be changed but the category will no change.
The aim of this analysis is to
Get an overview and document of the posts made to Life in 2017
Look at the growth of this category over 2017
Look at the earnings of this category during 2017
Look at top authors of this category
The data and the query
I have connected to the Steemsql database held and managed by @arcange using Microsofts Power BI
The SQL query used for this exploration is
Select *
 FROM comments (NOLOCK)
 where
 ( created >= CONVERT(datetime,'01/01/2017')
  AND created< CONVERT(datetime,'01/01/2018')) and
  Depth = 0
  And category  in ('life')
This query will pull all of the Posts made during 2017 in the category life. It will ignore any comments and will also ignore tags. Just to point out, the first tag that is selected on a post is the category in which a post is recorded.
After this I carried out further transformations on the data using M. First with this piece of code I removed any columns I did not want
   = Table.SelectColumns(Source,{"author", "title", "body", "created", "children", "total_payout_value",
    "net_votes", "pending_payout_value", "total_pending_payout_value"})
Then with this piece of code I changed the data type on the date field
= Table.TransformColumnTypes(#"Removed Other Columns",{{"created", type date}})
After this I loaded the data into the model and proceeded to model the data using DAX calculations.
The Analysis
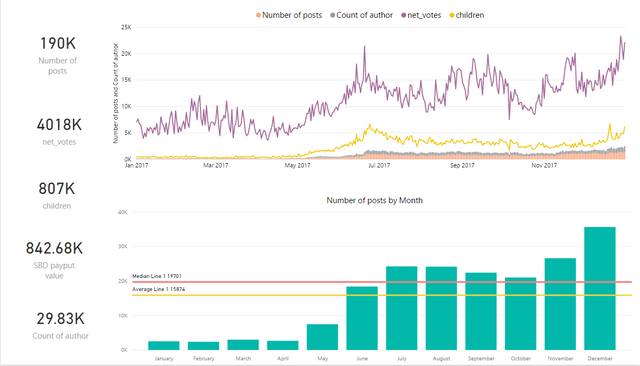
In 2017 190K posts were created in the LIFE category by 29.83K authors. These posts netted 4018K votes and 807K comments and also generated a total SBD pay-out value of 842.68K.
The average number of monthly posts to Life is 15,874 and the median is 19,701. From May to July there was a steady increase in the number of posts per month. This then declined slightly in September and October, increasing again in Nov and Dec.
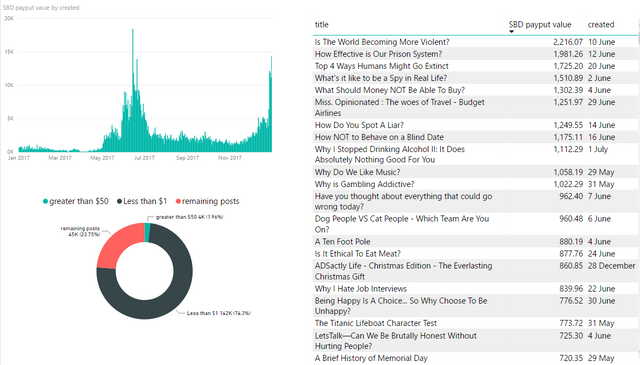
The visualisation above look at the SBD pay-outs. The bar chart shows the pay-outs over time. We can also see that 24% of posts earn between $1 and $50. This is the same as the Blog tag. Less than 2% of posts earned over $50. The balance of posts earned less than $1. The table on the right shows the top preforming posts in Life for 2017.
Let’s take a look at some averages
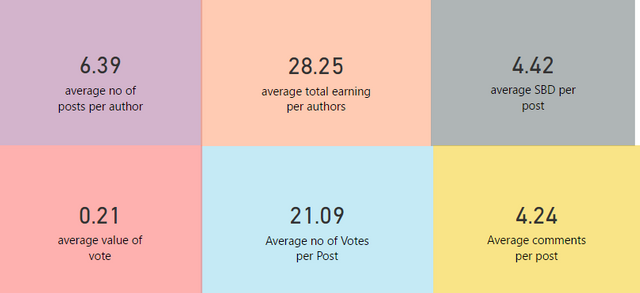
29.83K authors produced on average 6.39 posts each to the life category. The total of these 6.39 posts earned SBD 28.25 with the average post earning 4.42 SBD. On average each post received 4.24 comments and 21.09 votes. The average vote value on posts in the Life category was 0.21 SBD
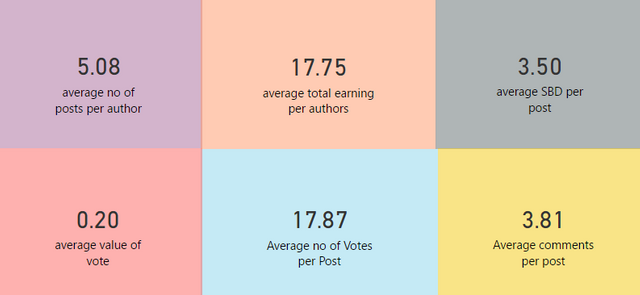
For comparison the averages on the BLOG category are shown below
We can also view these averages over the year of 2017, we can see some peaks in payments from May to June with a decline till December where we can see another rise is all line except the average number of posts per author.
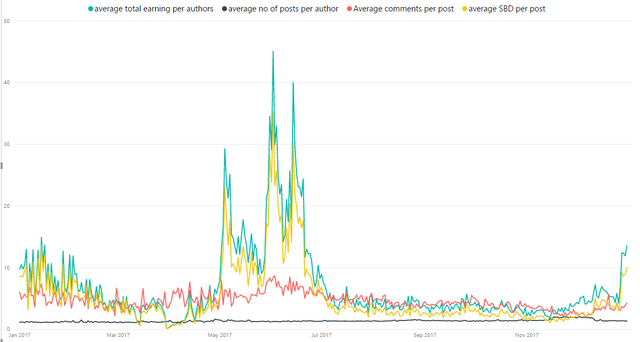
If we view the same information over months instead of days
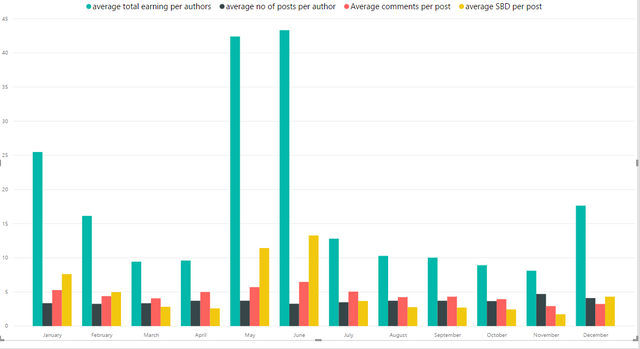
We can see clearer now that the average SBD per post peaked in May and June, and then decreased again until another rise in December. It is also clear to see that the average number of comments left on a post also peaked in June and decreased from then with a small increase again in December.
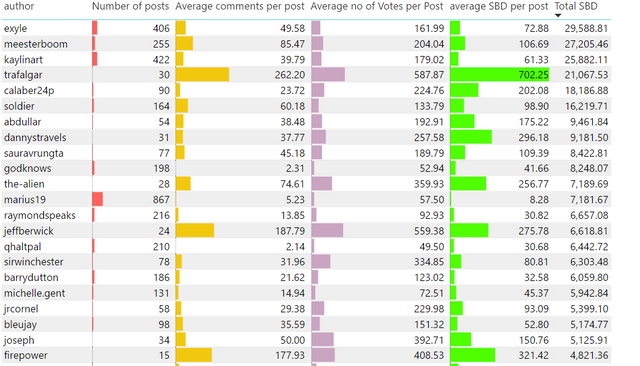
Having a look at the authors that posted to the LIFE category, first I have sorted the data by the average number of comments per post. Comments are an awesome reflection on engagement within the post.
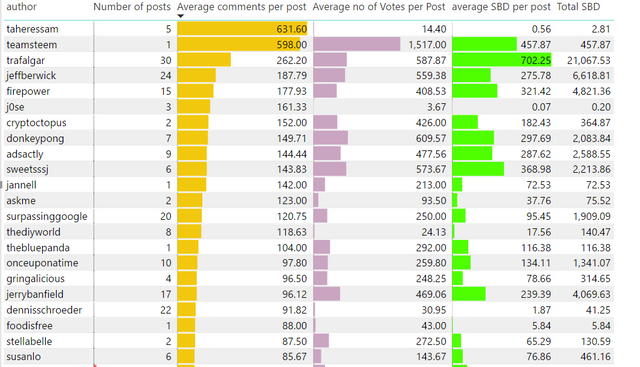
I then sorted the data by the average number of votes per post
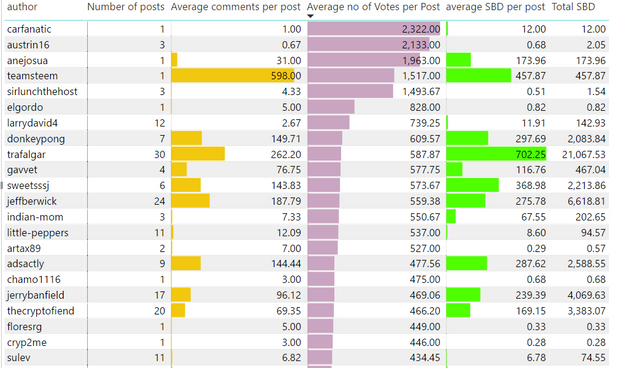
And finally I have sorted the data by the total SBD pay out value on posts to cryptocurrency by author
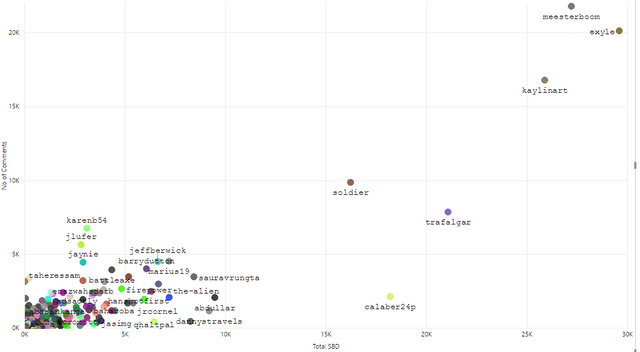
The following cluster chart shows the Number of comments against the Post SBD pay out.
Conclusion
The Life tag/category on steemit is a busy and competitive category
We can see clearly that posts on average in the LIFE category tend to do better in terms of votes, payouts and comments than posts made in the BLOG category. However the overall trends remain the same.
You can find a full analysis of the BLOG category here
https://utopian.io/utopian-io/@paulag/steemit-2017-round-up-analyzing-the-blog-category
You can find a full analysis of the cryptocurrency category here
https://steemit.com/utopian-io/@paulag/steemit-2017-round-up-analyzing-the-cryptocurrency-tag
On saying that, this analysis does not take into consideration the quality of the post, however I do class comments as a good indicator of engagement. I am hopeful that the more quality the post, the more comments.
I am part of a Blockchain Business Intelligence community. We all post under the tag #BlockchainBI. If you have an analysis you would like carried out on Steemit or Blockchain data, please do contact me or any of the#BlockchainBI team and we will do our best to help you...
You can find #BlockchainBI on discord https://discordapp.com/invite/JN7Yv7j
Posted on Utopian.io - Rewarding Open Source Contributors
Thank you for the contribution. It has been approved.
Hi @paulag, nice work again! I'm surprised to see the same peak in the SBD payout than for the blog category, but I didn't notice it for the cryptocurrency tag. Did you check what was the reason for this peak? Are those the same posts with both "blog" and "life" tags or is there something else?
You can contact us on Discord.
[utopian-moderator]
Hey @crokkon, I just gave you a tip for your hard work on moderation. Upvote this comment to support the utopian moderators and increase your future rewards!
no there are not the same posts, but the trend is very much the same. It seems to be before the HF and change in rewards. If I can get a third tag to verify this trend I will know more
Great information. thanks for sharing @paulag
wow, hardcore metrics and info paulag. Interesting to see perspective of the spikes in SBD payouts at those times because that is scaling from the changes to steem price if I recall correctly, so it's a good way to look at how the idea of $1 SBD peg actually plays out despite the information being tailored to a specific tag.
number of posts seems to have steady increase over time but payout varies drastically based on market condition, I am actually surprised to not see a giant spike in activity when the value increases payouts for some surge of people jumping back in if they have been idle, or increasing their posting frequency.
A lot of insight can be derived from data like this, I will be interested to know what others make of it
I was expecting a larger peak in Dec myself, but lets see what the Jan data shows
nice article...
A very useful tutorial for everyone, especially in collecting their respective community activities @paulag, we in the NSC community will try to make those tools, with activities that will be created by programmer @binjeeclick.
good work and very useful analysis I like this
@paulag wow amazing analysis of the data. You are an asset to the community. Such analytical data would help authors.
I ll follow you from now on. I was about to post About health. Can you help me. I want to write about Global warming, Drought, health, Food and Agriculture. What tags I must use?
By the way I loved you analysis. Retsteeming. And upvote.
Dammit, my name is nowhere on the list and I always post in that category... must try harder :D
Great analysis as always @paulag. I don't think I have said thank you for inspiring me and many others I know to explore Steemit data. I am using #blockchainbi on my data posts. I hope you don't mind.
As expected from my favorite contributor for analysis, from my recent analysis the #life category always performing well and always excel all the other tags. I can see that in this tag there's a lot number of post, comments and votes among any other tags. No wonder it is always placed number 1.
Thanks for sharing this excellent analysis for us miss @paulag, the DAX presentation really presentable, how I wish I know how to manuever that software.
lol power bi is easy when you know how, I have a free intro course available on my site if you want to take a look