用Chart.js 2.7 创建线形图|Create Line Chart with Chart.js 2.7
Summary:
Chart.js provides simple yet flexible javascript charting for designers & developers. It has become one of the most popular open source charting libraries and i will show you how to create a line chart with chartjs today.I choose the total and per capita GDP in the top 10 economies of the world in 2017 as the original data. I use the newest version of Chart.js which is different from the older ones.
Chart.js为设计师和开发者提供简单而灵活的javascript图表设计,它已经成为了最受欢迎的开源图表库之一,今天教程将教大家如何使用Chart.js去绘制一张线形图。我选取的原始数据是2017年世界前10大经济体的GDP总量和人均GDP数据。采用的Chart.js版本是和以前的版本不太一样的最新的2.7.1版本。
兼容浏览器:一切支持canvas的浏览器,IE9,Chrome,Firefox等等
Chart.js版本: 2.7.1(最新版本)
您能从本教程学到什么?
- 代码整体结构
- 怎样调用Chart.js
- chartjs的容器
- 怎样创建chart对象
- 曲线图的数据结构
- 曲线图的参数选项
- 生成并渲染对象
准备条件
- 一个代码编辑器,如WebStorm和atom
- 一个可供调试的浏览器:IE, Chrome或是Firefox
难度
- 中等
教程内容
由于HighChart.js的崛起,开源的数据图形库普遍重构了代码,Chart.js在2.0之后就和1.0完全不一样,我们就看看最新版本的Chart.js怎样创建线形图。
代码整体结构
<script src="path/to/Chartjs"></script>
<canvas id="myChart" width="600" height="400"></canvas>
<script>
var data = {}
Line.defaults = {}
var ctx = document.getElementById("myChart").getContext("2d");
var chart = new Chart(ctx, {
    type:{},
    data:{},
    options:{}
});
</script>
原始数据
本教程的原始数据选择2017年世界前10大经济体的GDP总量和人均GDP数据。
| 国家 | GDP总量(亿美元) | 人均GDP(美元) |
|---|---|---|
| 美国 | 186979.22 | 57765.512 |
| 中国 | 122539.75 | 8865.999 |
| 日本 | 41706.43 | 33010.024 |
| 德国 | 34725.07 | 42388.679 |
| 英国 | 30548.4 | 46719.862 |
| 法国 | 24788.48 | 38575.438 |
| 印度 | 23847.26 | 1820.8 |
| 意大利 | 18675.72 | 30540.566 |
| 巴西 | 16728.68 | 8117.645 |
| 加拿大 | 15928.48 | 44095.85 |
要点1:怎样调用Chart.js
本地路径调用
<script src="path/to/Chartjs"></script>
CDN调用
<script src="https://cdnjs.cloudflare.com/ajax/libs/Chart.js/2.7.1/Chart.js"></script>
可以使用以上两种方式引入Chart.js
要点2:chartjs的容器
Chartjs不同于HighCharts.js,HighCharts.js基于的是SVG,而Chart.js基于的是canvas,所以chartjs的容器仅需一个canvas元素即可。
<canvas id="myChart" width="400" height="400"></canvas>
要点3:怎样创建chart对象
获取canvas元素有两种方式,一种方式是使用javascript原生的getElementById的方式
var ctx = document.getElementById("myChart").getContext("2d");
另一种方式是用jQuery获取canvas的context。首先从jQuery集合中获取我们需要的DOM节点,然后在这个DOM节点上调用 getContext("2d") 方法。
<script src="https://code.jquery.com/jquery.min.js"></script>
var ctx = $("#myChart").get(0).getContext("2d");
获取canvas元素后,需要在指定canvas元素上实例化Chart对象。
var chart = new Chart(ctx, {
    type: 'line',
        data: data,
        options: options
    });
要点4:曲线图的数据结构
var data = {
    labels : ["美国","中国","日本","德国","英国","法国","印度","意大利","加拿大"],
    datasets : [
        {
            label: "GDP总量",
            fill: true,
            backgroundColor : "rgba(220,220,220,0.5)",
            borderColor : "rgba(220,220,220,1)",
            pointBackgroundColor : "rgba(220,220,220,1)",
            pointBorderColor : "#fff",
            cubicInterpolationMode: "default",
            data : [186979.22,122539.75,41706.43,34725.07,30548.4,24788.48,23847.26,18675.72,16728.68,15928.48]
        },
        {
            label: "人均GDP",
            fill: true,
            backgroundColor : "rgba(151,187,205,0.5)",
            borderColor : "rgba(151,187,205,1)",
            pointBackgroundColor : "rgba(151,187,205,1)",
            pointBorderColor : "#fff",
            cubicInterpolationMode: "default",
            data : [57765.512,8865.999,33010.024,42388.679,46719.862,38575.438,1820.8,30540.566,8117.645,44095.85]
        }
    ]
}
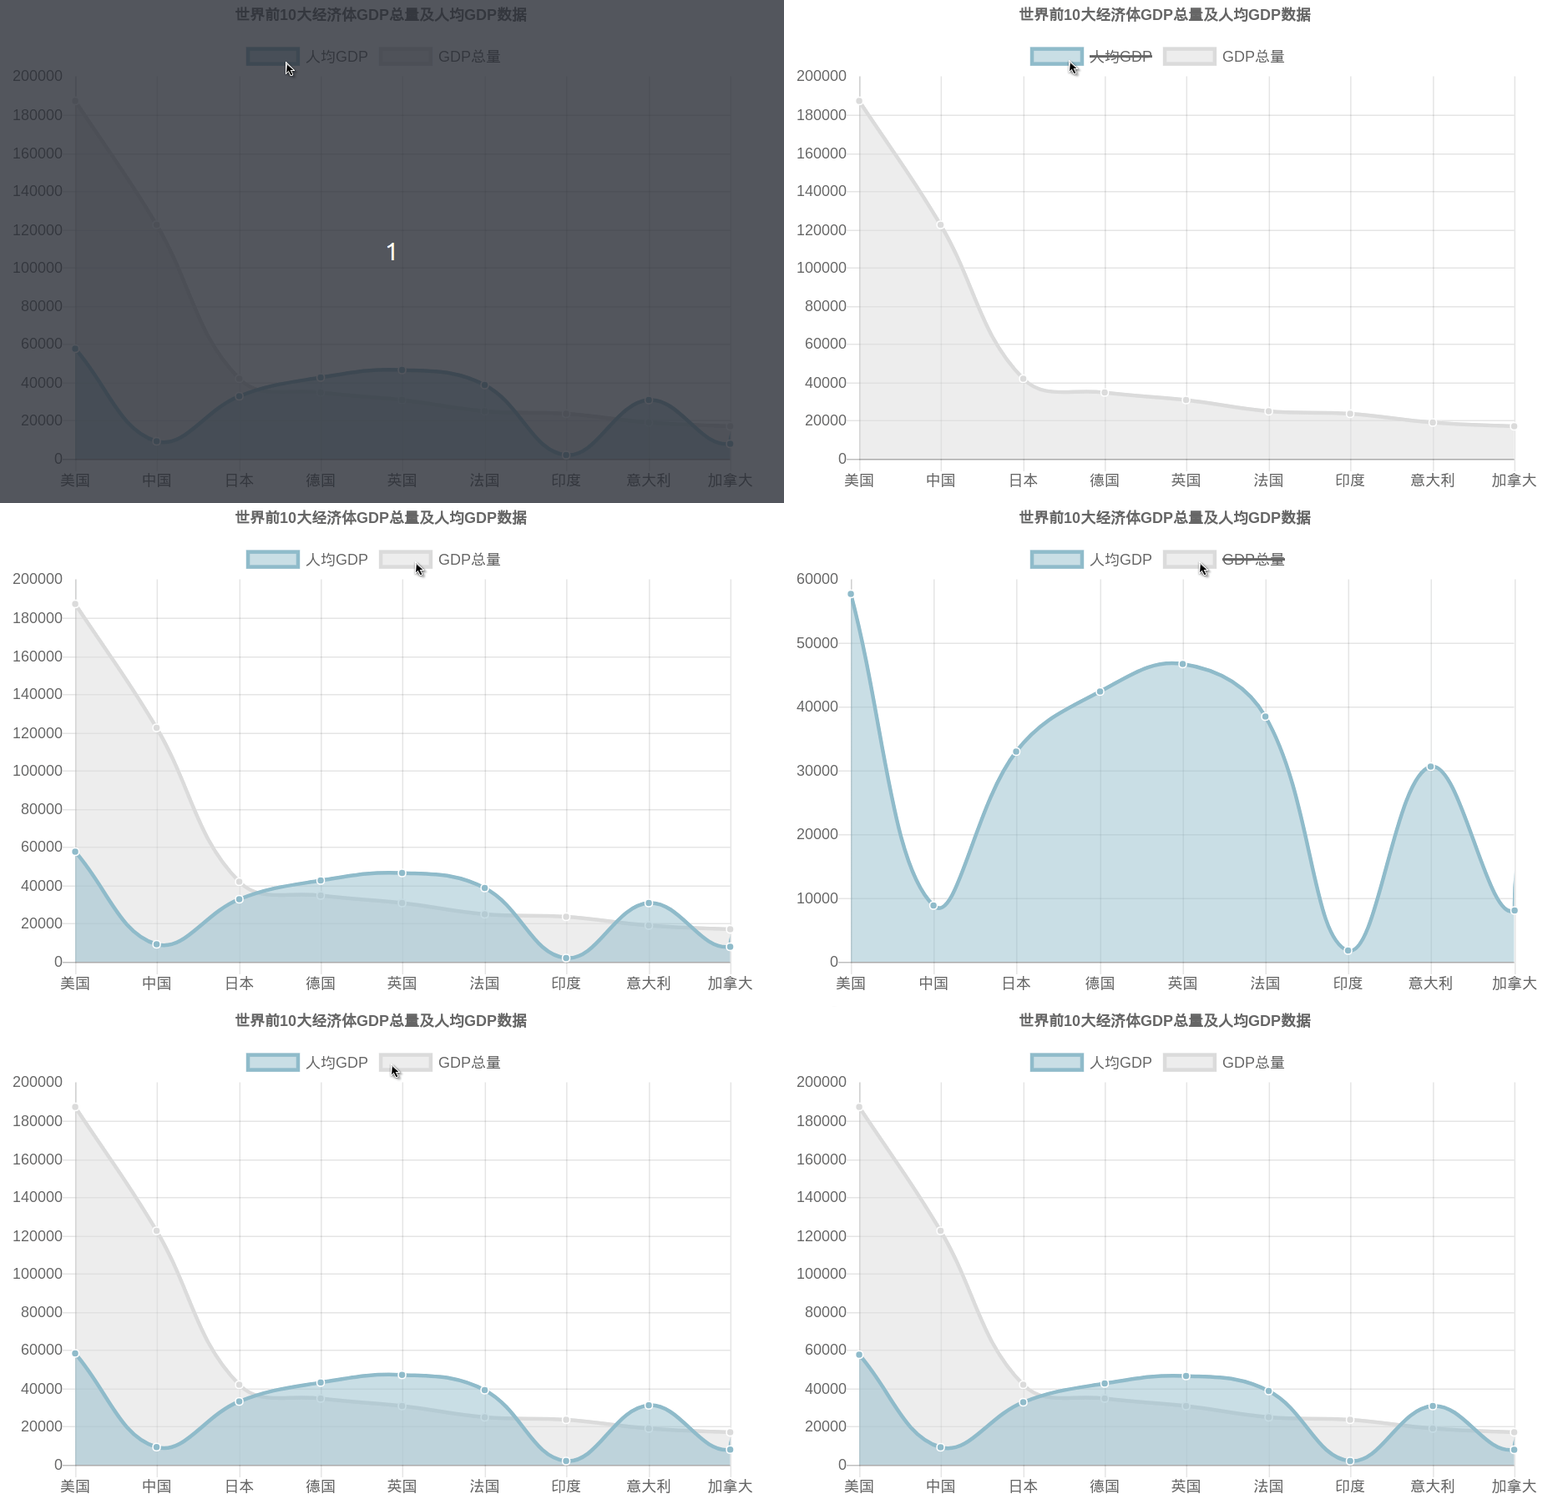
其中labels代表的即是横坐标的标签,本数据中就是国家的名称。而datasets则是具体的数据的值,其中每个dataset就是一根曲线的数据,本数据定义了两根曲线。
在某根曲线的具体定义中,backgroundColor指的是曲线下部填充区域的颜色,borderColor指的是曲线本身的颜色,而pointBackgroundColor指的就是数据点的颜色,pointBorderColor指的是数据点边缘线的颜色。一般来说,backgroundColor和borderColor可以用透明度不同来区分。
cubicInterpolationMode指的是插值模式,有"default"和"monotone",按通俗理解,"default"指的是非线性插值,"monotone"指的是线性插值。
dataset还有许多参数选项,这里不一一列出。
要点5:曲线图的参数选项
var options = {
            responsive: false,
            title: {
            display: true,
            text: '世界前10大经济体GDP总量及人均GDP数据'
        }
    };
responsive就是是否响应式设计,如为true,则canvas的width和height自动不生效,随浏览器变化。
title就是图表的标题的意思,其中display就表示标题是否展现,text就是标题的内容。
options还有许多参数选项,这里不一一列出。
最终:生成并渲染对象

Posted on Utopian.io - Rewarding Open Source Contributors
Thank you for the contribution. It has been approved.
You can contact us on Discord.
[utopian-moderator]
Hey @mucyoung I am @utopian-io. I have just upvoted you!
Achievements
Suggestions
Get Noticed!
Community-Driven Witness!
I am the first and only Steem Community-Driven Witness. Participate on Discord. Lets GROW TOGETHER!
Up-vote this comment to grow my power and help Open Source contributions like this one. Want to chat? Join me on Discord https://discord.gg/Pc8HG9x