Tutorial #18 Dive into DC.JS a JavaScript Library - Data Count and Reset (Last Tutorial)
What Will I Learn?
Write here briefly the details of what the user is going to learn in a bullet list.
- Count all data using dc.js
- Reset Charts individually
- Reset All Charts
Requirements
- Basics of HTML and CSS
- Essentials of JavaScript
- Crossfilter.js and d3.js methods
Difficulty
- Intermediate
Tutorial Contents
- Introduction
- Create Working Environment
- Count all data
- Reset Charts
- Rest All the Charts
- Reset Chart Individually
Introduction
Today, in this tutorial we'll teach you how to count the all the data and also counts the filtered data in chart in dc.js. Once you filtered the charts, you need to reset the charts, here we also discuss how to reset the charts individually and all the charts at the same time.
Create Working environment
Setting up a working environment for this tutorial we will use the all the code from our previous tutorial: Link Two Charts, copy and paste the whole code in you new file and save it into your working directory.
<!DOCTYPE html>
<html lang="EN">
    <head>
      <meta charset="utf-8">
      <title>Data Count and Reset Charts</title>
      <script type="text/javascript" src="https://cdnjs.cloudflare.com/ajax/libs/d3/3.5.1/d3.min.js"></script>
      <script type="text/javascript" src="https://cdnjs.cloudflare.com/ajax/libs/crossfilter/1.3.12/crossfilter.min.js"></script>
      <script type="text/javascript" src="https://cdnjs.cloudflare.com/ajax/libs/dc/2.1.9/dc.min.js"></script>
      <link rel="stylesheet" type="text/css" href="https://cdnjs.cloudflare.com/ajax/libs/dc/2.1.9/dc.min.css" />
      <link href="https://maxcdn.bootstrapcdn.com/bootstrap/4.0.0/css/bootstrap.min.css" rel="stylesheet" integrity="sha384-Gn5384xqQ1aoWXA+058RXPxPg6fy4IWvTNh0E263XmFcJlSAwiGgFAW/dAiS6JXm" crossorigin="anonymous">

      <style>
       #main{
          width: 100%;
          padding: 10px;
          //border: 1px solid black;
      }
      div{
          overflow: auto;
          float:left;
      }
      td {
        border: 1px solid gainsboro;
      }
      h1{
          text-align: center;
      }

       #pieChart,  #table{
          margin: 10px 10px 10px 20px;
          width:40%;
          //border: 1px solid black;
      }
       #dataTable {
          text-align: center;
          width:50%;
      }
      </style>
    </head>
    <body>
        <h1>Data Count and Reset Charts</h1>
        <div id="main">
            <div id="pieChart"></div>
            <div id="table">
                <table id="dataTable" class="table table-hover" align="center"></table>
            </div>
        </div>


        <script type="text/javascript">


          var paymentsRecord = [
          {date: "2011-11-14T16:17:54Z", quantity: 2, total: 190, tip: 100, type: "tab"},
          {date: "2011-11-14T16:20:19Z", quantity: 2, total: 190, tip: 100, type: "tab"},
          {date: "2011-11-14T16:28:54Z", quantity: 1, total: 300, tip: 200, type: "visa"},
          {date: "2011-11-14T16:30:43Z", quantity: 2, total: 90, tip: 0, type: "tab"},
          {date: "2011-11-14T16:48:46Z", quantity: 2, total: 90, tip: 0, type: "tab"},
          {date: "2011-11-14T16:53:41Z", quantity: 2, total: 90, tip: 0, type: "tab"},
          {date: "2011-11-14T16:54:06Z", quantity: 1, total: 100, tip: 0, type: "cash"},
          {date: "2011-11-14T16:58:03Z", quantity: 2, total: 90, tip: 0, type: "tab"},
          {date: "2011-11-14T17:07:21Z", quantity: 2, total: 90, tip: 0, type: "tab"},
          {date: "2011-11-14T17:22:59Z", quantity: 2, total: 90, tip: 0, type: "tab"},
          {date: "2011-11-14T17:25:45Z", quantity: 2, total: 200, tip: 0, type: "cash"},
          {date: "2011-11-14T17:29:52Z", quantity: 1, total: 200, tip: 100, type: "visa"}
        ];

        paymentsRecord.forEach(function(d){
            //console.log(typeof(d.date)); //check the type before it changes
            var orgDate = new Date(d.date); // changes the string date into origional date type
            d.date = orgDate; // Overwrite the String date with Original date type
            console.log(typeof(d.date)); //check the type after make change, you can see it converts into date object
        });

          var facts = crossfilter(paymentsRecord);

          // Data Table
        var facts = crossfilter(paymentsRecord);
        var dimensionByDate = facts.dimension(function(d){ return d.date; });

        // Pie Chart by Payment Type

        var dimensionByType = facts.dimension(function(d){ return d.type; });
        var groupByType = dimensionByType.group();


        var dataTable = dc.dataTable("#dataTable")
              .width(1360)
              .height(300)
              .dimension(dimensionByDate)
              .showGroups(false)
              //.size(7)
              .group(function(d){ return d.type; })
              .columns([{label:'Time',format: function(d){ return d.date.getHours()+':'+d.date.getMinutes(); }},
                        'quantity',
                        'total',
                        'tip',
                        'type',

                    ])
              .sortBy(function(d){ return d.type; })
              .order(d3.descending);


        var barChart = dc.pieChart('#pieChart')
              //.width(1024)
              .height(250)
              .radius(150)
              .dimension(dimensionByType)
              .group(groupByType)


        dc.renderAll();
          </script>
    </body>
</html>
Output:
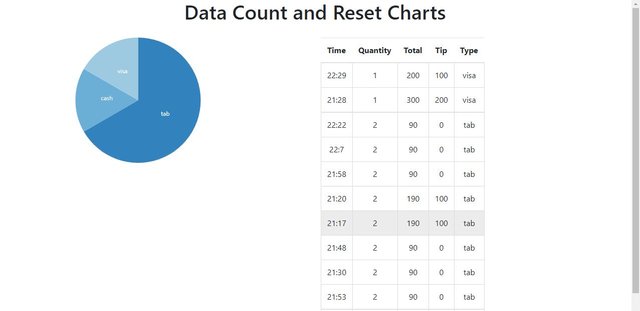
Now you have to write the HTML code for the div we use to show the counted data. Write this code under the pieChart div.
<div class="data-count" >Data Count: <span ></span> selected out of <span ></span></div>
Now give some styling to the data count div
      div.data-count{
          margin-left: 130px;
          text-align: center;
      }
Output:
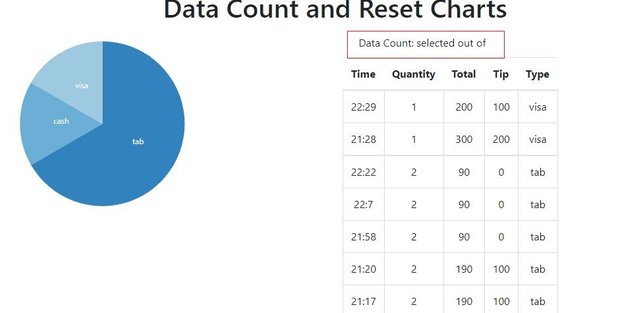
Count all data
Above we set up our working environment for our work and now we'll move to count the data, We'll use the dataCount class of the dc.js library in order to count the data. Create an object of the dataCount class and also pass the class of the div we created above for the data count.
        var dataCcount = dc.dataCount(".data-count")
              .dimension(facts)
              .group()
Here we pass the crossfilter variable as the dimension of the data. The group, you can see is empty, here we'll group the all the corssfilter data and pass it into the .group([]) method.
          var facts = crossfilter(paymentsRecord);
          var groupAll = facts.groupAll();
Now pass the group of the data to .group([]) method
        var dataCcount = dc.dataCount(".data-count")
              .dimension(facts)
              .group(groupAll)
If you see the output there is nothing happens, to who the data, we'll use the dc.js classes: filter-count and total-count, add the classes to tab we created above.
<div class="data-count">Data Count: <span class="filter-count"></span> selected out of <span class="total-count"></span></div>
Output:
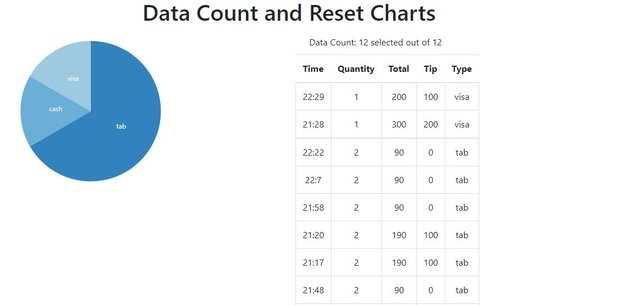
You can see it counts the record for us, first number is the filtered data and the second number is for total records we have. If we filters the chars you'll see the filtered data has changed.
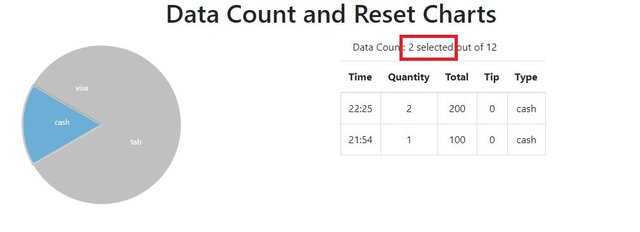
As we selected cash in the pie chart it shows us only the payment done with through cash and our filtered number changes to 2 because we have only 2 record with cash payment.
dc.js also provide us the dc-data-count class specific to data counts change this class with the data-count class in the div and every where in the code where we use this class.
<div class="dc-data-count">Data Count: <span class="filter-count"></span> selected out of <span class="total-count"></span></div>
In our CSS
      div.dc-data-count{
          margin-left: 130px;
          text-align: center;
      }
And Also in our dataCount class object.
        var dataCcount = dc.dataCount(".dc-data-count")
              .dimension(facts)
              .group(groupAll)
Output:
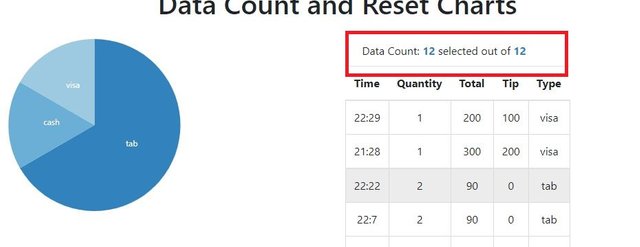
You can see it automatically do the styling for us.
.html({}) method
Here we also have an interesting method we'll use it to do some cool work, it takes two arguments some and all
Use this method
        var dataCcount = dc.dataCount(".dc-data-count")
              .dimension(facts)
              .group(groupAll)
              .html({
                  some: '<strong>%filter-count</strong> selected out of <strong>%total-count</strong> records. ',
                  all: 'All records selected. Please click on the graph to apply filters.'
                });
Output:
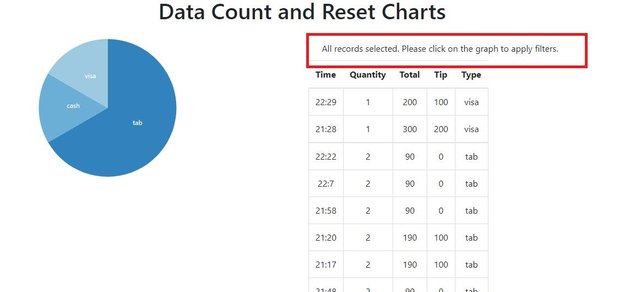
You can see it only show us the message that we have selected all the records but if we filters the data.
Output:
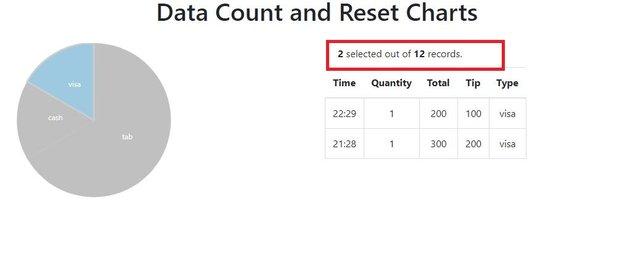
When we filter the data it changes the message.
Rest Charts
Rest All the Charts
To reset the all the charts we'll use the two methods of the dc.js: dc.filterAll() and dc.renderAll() Use this methods as in the code
dc.filterAll(): Reset the data by removing all the filter from all dimensiondc.renderAll(): Redraw all the charts again
<div id="reset"> <a class="reset" href="javascript:dc.filterAll(); dc.renderAll();">Reset All</a></div>
Output:
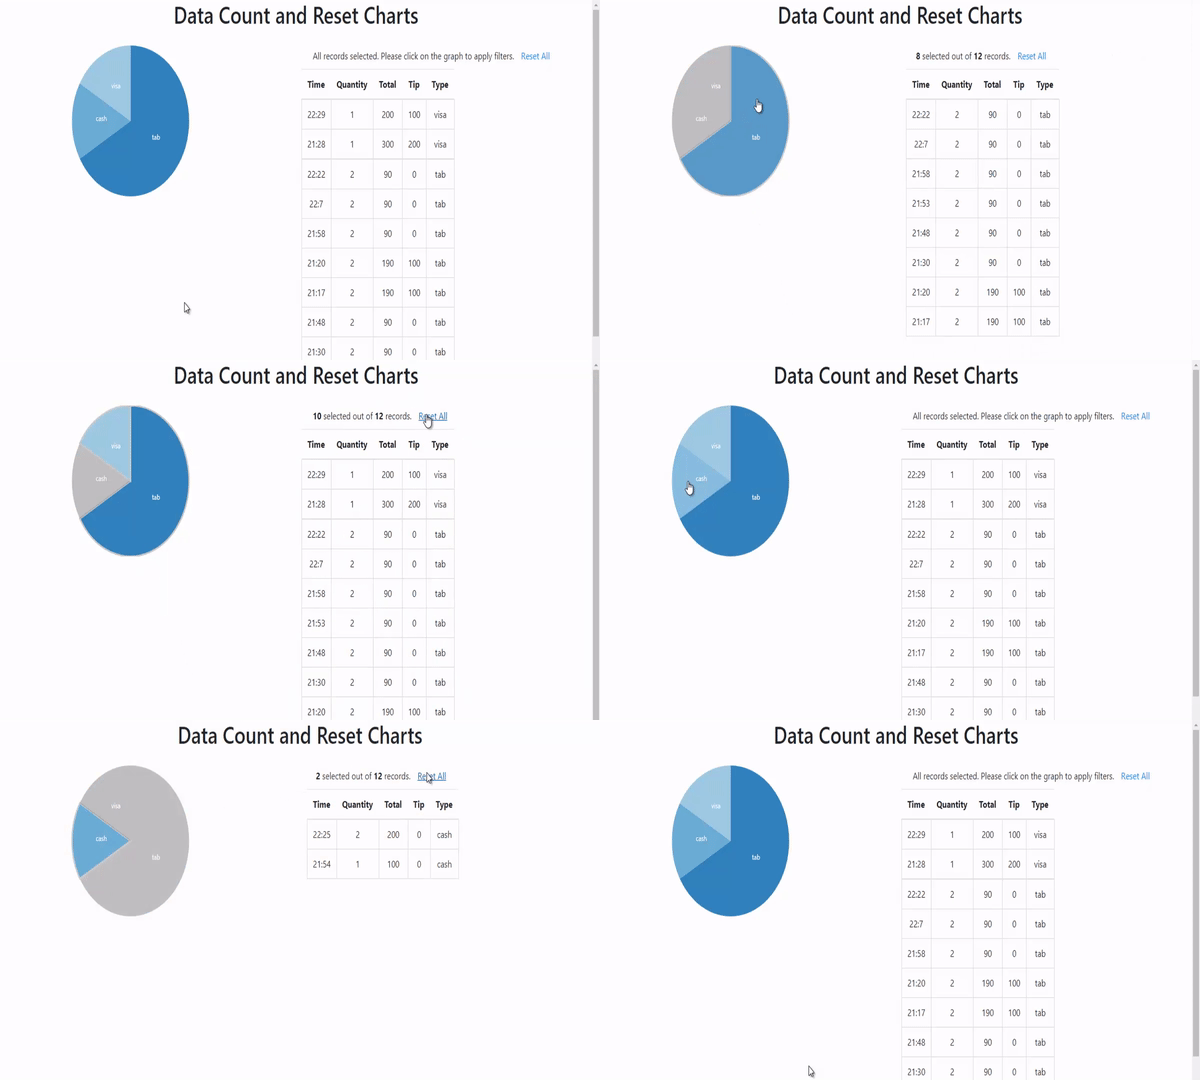
Reset Chart Individually
To reset only a single chart instead of all the charts use this code.
<a class="reset" style="display:none" href="javascript:pieChart.filterAll(); dc.redrawAll();">reset</a>
This will only reset the pieChart, and this is the object of the pieChart Class. Apply it by yourself in the code. If this not works for you you can see how to apply it in our DC Charts Dashboard source code.
Curriculum
Tutorial #17 Dive into DC.JS a JavaScript Library - Range Series Chart
Tutorial #16 Dive into DC.JS a JavaScript Library - Link two Charts
Tutorial #15 Dive into DC.JS a JavaScript Library - Range Chart
Tutorial #14 Dive into DC.JS a JavaScript Library - Row Chart
Tutorial #13 Dive into DC.JS a JavaScript Library - Data Table Pagination
Tutorial #12 Dive into DC.JS a JavaScript Library - Heat Map Chart
Tutorial #11 Dive into DC.JS a JavaScript Library - Geo Choropleth Chart
Tutorial #10 Dive into DC.JS a JavaScript Library - Box Plot
Tutorial #9 Dive into DC.JS a JavaScript Library - Series Chart
Tutorial #8 Dive into DC.JS a JavaScript Library - Bubble Chart
Tutorial #7 Dive into DC.JS a JavaScript Library - Data Table
Tutorial #6 Dive into DC.JS a JavaScript Library - Stacked Bar Chart
Tutorial #5 Dive into DC.JS a JavaScript Library - Scatter Plot
Tutorial #4 Dive into DC.JS a JavaScript Library - Composite Chart [Left, Right]
Tutorial #3 Dive into DC.JS a JavaScript Library - Line Chart
Tutorial #2 Dive into DC.JS a JavaScript Library - Pie Chart
Tutorial #1 Dive into DC.JS a JavaScript Library - Bar Chart
Posted on Utopian.io - Rewarding Open Source Contributors
Thank you for the contribution. It has been approved.
You can contact us on Discord.
[utopian-moderator]