Scraping Web Data with R
This is the third part of a 9 part tutorial series about the R Statistical Programming Language, targeted at data analysts and programmers that are active on Steem.
In this course you will learn the R programming language through practical examples.

Repository
The R source code can be found via one of the official mirrors at
This tutorial is part of a series, the text as well as the code is available in my github repo
What Will I Learn?
The first two tutorials introduced the basics of R, the rest of this series will focus on worked examples where we will slowly introduce new concepts and learn some of the extended functionality of the R programming language.
In this tutorial you will:
- Get an Introduction & some tips on Web-scraping
- Consider the Limitations of R for Web-scraping
- Discover Task Views a way to find packages in R
- Web-scrape & Plot CoinMarket Cap with R, just 6 lines of code
- Learn the basics of data wrangling with R
- Practice using the data.table and ggplot packages
Requirements
- Lesson 1 Introduction to R
- Lesson 2 Finding Your Way Around R
- Basic Knowledge of Statistics
- Basic Programming Experience
- Some Knowledge of Steem and Cryptocurrencies
Difficulty
Intermediate

Introduction to Web Scraping
If you're a data junkie like me you will always be on the lookout for new and interesting datasets. Ok data may not be very interesting but exploring it with machine learning models and dynamic visualizations is fun. Getting insights from the noise is a skill and I assure you it will make people speak in hushed tones when you walk by :)
So what data can you scrape and where is the best place to look for it?
Terms of Service
The web is a great source of data which can be easily accessed. It is important to note that scraping web data may be against the terms of service of a website so you should check this before attempting to download data. When and if you should download data is outside the scope of this tutorial.
Tips before you start coding
If you find a webpage with data you can of course print it off and manually type the results in a spreadsheet and viola, but for anything more than a few numbers you may be better off automating it in some way.
Tip 1: Check if the website has a download button or API
I don't know how many times I have spent ages pulling together a script for data scraping to realise there is a form or download button which delivers all the data in a nicely formatted spreadsheet at the touch of a button.Tip 2: Check if the data is available from somewhere else
If someone has done the work already there is no point in reinventing the wheel, e.g. use steemsql or other services.Tip 3: Copy and paste
This technique is often the quickest. I would recommend this method for individual tables on ad hoc analysis but be careful, formats can sometimes get messed up.Tip 4: Use Excel
Excel lets you Link to External Data and import the tables for the website. This is a great option for many purposes, you can even write VBA macros to loop thorough sites. It works pretty well for some ues cases.
These first 4 tips are my go to methods for scraping data. See if they get you what you want before building a scraper.
When do you need a scraper?
I would recommend using a more advanced method in the following 3 cases
- If you regularly need to get an update from a website
- If you need to download data from many pages on a website
- If the website does not let you copy data due to some strange formatting or plugins, this may be a sign your not supposed to download the data to check the terms of service first.
I thought this was a tutorial about R...
Limitations of R
R is not the best tool for webscraping, in fact R is not the best tool for many things. If you have some industrial scale scraping to do, Python is king. You can build crawlers with it and there are libraries to handle almost any web page format. R is not particularly fast but the benefit of using R is that it is easy to get data for many useful situations. Today we will download Coinmarket Cap data and plot the historical Steem price using just 6 lines of code.
Webscraping with R
I use the following method for Webscraping;
- Find a weblink,
- Download the data useing a package/software
- Clean and formt the data

You need to install Packages for almost any task besides basic statistics. Before delving into our worked example for today we will take a minute to learn how to search for R packages....
R Packages & Task Views
We learned in the last lesson the main repository for R packages is called CRAN. On their website you can see a list of the packages available
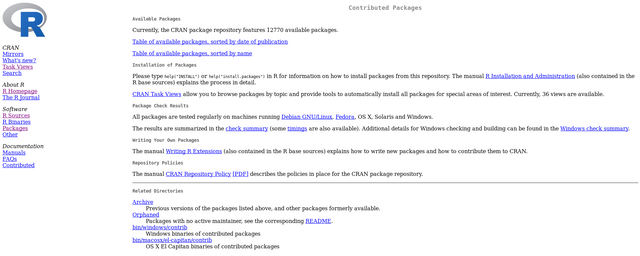
There are 12,770 packages available. It can be hard to find the one you want and this is actually a limitation of R. Anyone can submit a package. There is no central coding standard, just basic submission and documentation standards applied. This means that there may be multiple packages that do the similar things. In order to help you find the one you are looking for packages are organised into Task Views, or groupings of related packages.
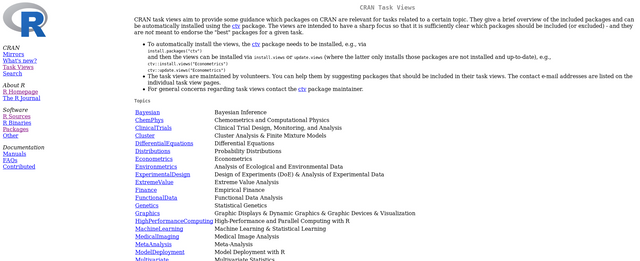
I will leave it with you to explore the key R packages in each task view, for today's tutorial we will continue with a very easy to use package for querying we data.
Install Our Web scraping Package
As we did in the last lesson we will begin by opening up R Studio and creating a new script for storing our code. The package.
We will next install the scraping package we will be using today, "htmltab".
Type the following code in the script and hit ctrl + enter to run it in the command line.
install.packages(htmltab, dependencies=True)
- Can you remember the (non code) way to install a package which you we covered in lesson 2?
Next we will load the package htmltab, Type the following code in the script and hit ctrl + enter to run it in the command line.
library(htmltab)
- There is also another way to load a package, can you remember?
Useful Packages for Data and Plotting...
Before we continue we will next load 2 packages we have seen before and which we will make use of in each tutorial.
library(data.table)
library(ggplot2)
- Can you remember what these two packages were for?
We have loaded our web-scraping package, we are ready to start!

Find the Web Link
The first stage of web scraping is find a web link for a page that has data to download.
In this tutorial we are going to download historical prices from Coinmarket Cap for Steem. If you head over to Coinmarket Cap you will notice a tab Historical Data. This is where we will start. The "Finding the Weblink" stage generally involves a bit of research till you find the right page.
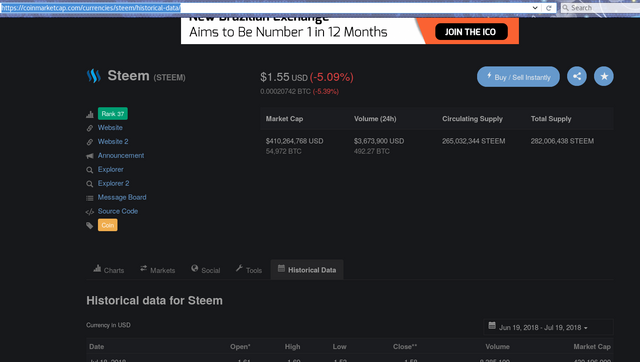
Examining this page we see this page only goes back for 3 days but you can choose a longer range by selecting the date button.

- We have chosen the last year
You will notice the URL at the top now changes on this site. This is what we have been looking for!

We have a suitable url to scrape so we can move on to coding it up in R.

Using the htmltab Package
We will next copy and paste the url to our R script and store it in a variable which we will call "url".
In our script type
url <- “https://coinmarketcap.com/currencies/steem/historical-data/?start=20170719&end=20180719”
This makes it easy to change if we want to change the date range for example.
We have put the link in Quotation marks and you may also notice we are now using a symbol <- for assignment. This is similar to the assignment operator we have been using before =, but <- is more generally used in R for assigning variables, it has a slightly different meaning than assignment with an equals sign.
Next in order to retrieve the data you can type into the script the following command and hit ctrl + enter
cmc <- htmltab(url)
- This should get the coinmarket cap data for Steem between those dates and store it in a data structure called cmc
Now if you type into the console
cmc
- you will see a print out of the table of data.
- You will also notice the variable appearing in the top right of R studio
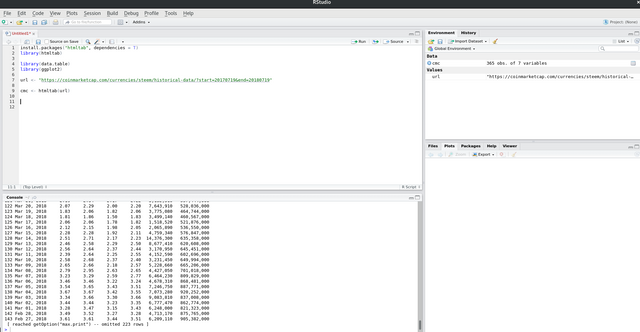
- At the top right of R Studio you will see that we have 365 observations in the cmc data structure. Expand out the cmc data by clicking on the blue circle next to it in the Environment window
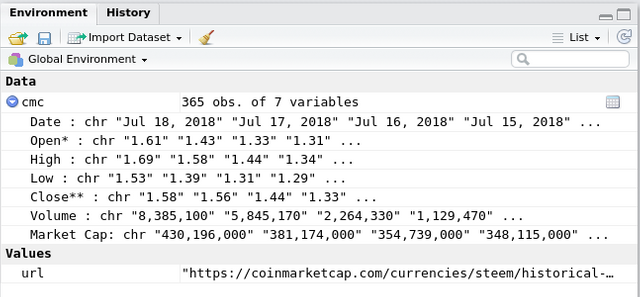
- You will notice here each heading of the tables (from Coin Market Cap) are the names of variables in the cmc data structure.
- You will also notice that the variables are all stored as characters. They print like numbers and dates when you see them in the console but they are not stored as numbers.
Data Tables
We are going to plot this data but before we do we need to clean it and format it correctly. In the last lesson we introduced the concept of a data.frame, a rectangular data structure. That is what cmc is, many packages use data.frame for historic reasons but we prefer storing data as a newer data.table structure. I would urge you to forget about using data frames and just head straight to using Data Tables.
We will convert our data.frame to a data.table by typing the following command
cmc <- data.table(cmc)
We now have the Coinmarket Steem Prices for the last year stored in our data strcuture cmc.
To see the first row of the data table type
cmc[1]
- Data Tables use Square brackets for specifying arguments.

Cleaning the Data/ The basics of data wrangling in R
We mentioned that our dats is stored as characters. Before we can plot our data we need to convert the dates to a date data type and the prices to numeric data types. In the previous lesson that there are two basic data types in R;
- Characters
- Numeric
Date is not a base data type but a combination of the two, a richer higher level data type.
Character to Number
To convert a character to a number we use the function as.numeric()
A data.table has a neat syntax for performing column wise operations, which we can see in the following example where we create a new column called "LowPrice" from the existing column called "Low"
cmc[ ,LowPrice := as.numeric(Low)]
- Data Tables use Square brackets for specifying arguments.
- The first argument is always the row number. Blank means apply to each row.
- The Second Argument is not necessary but if included it indicates some formula. In this case Low is the existing column name and we are assigning the value as.numeric(Low) to the new column Low.Price.
Character to Date
Our date is a Character variable, which we are going to convert to a date variable.
Can you guess what the function to do this is?
To convert a character to a number we use the function as.Date()
R is case sensitive and there are varying conventions. This can get a bit annoying but it is never hard to find the formula you are looking for thanks to R studio and the interactive console
The as.Date(x, format) function takes two arguments, the character variable to convert (x) and the format of the data (format)
The following table shows the available formats.
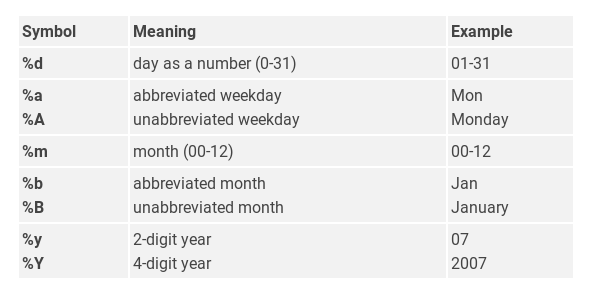
Source: https://www.statmethods.net/input/dates.html
In our case the command we wish to type is as follows
cmc[,PriceDate:=as.Date(Date, "%b %d, %Y")]
- Here the PriceDate is our new column name and the Date is the character column we are converting according to the format "%b %d, %Y"
Type
cmc
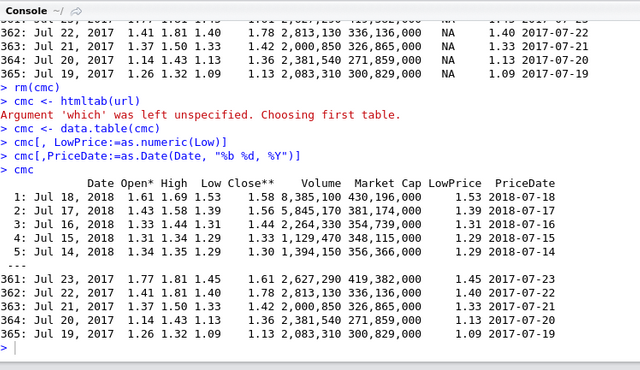
- In the terminal we now see a much neater print of the data than before and we notice our two new columns we created at the end.
Activity
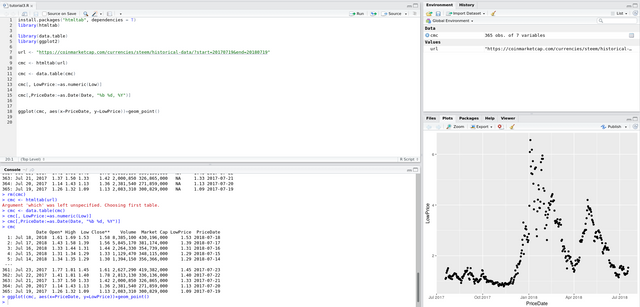
ML is a few lessons off but today we can graph the price of Steem for the last year using the ggplot2 package. Type the following command in our script and his ctrl + enter.
ggplot(cmc, aes(x=PriceDate, y=LowPrice))+geom_point()
You will see the Plot in the bottom right tab of R Studio
Recap
In this lesson:
- We got an introduction to Web scraping
- We learned some techniques and tips of when to use R for Web scraping
- We learned about task views
- We outlined some limitations of using R for web-scraping
- We used just 6 lines of code to scrape the Coin Market Cap website and plot the results.
Benefits of Using R for Webscraping
- The code is scripted so you can change the dates with easy and run it again and again.
- The packages are intuitive to use, and have intelligent features. We did not have to specify the layout of the CMC data, R just knew which date to get. Of course it does not always work but there are powerful tools to specify the data that we wish to scrape, which you can see more of in the Task View on CRAN mentioned earlier.
Code Used
url <- "https://coinmarketcap.com/currencies/steem/historical-data/?start=20170719&end=20180719"
cmc <- htmltab(url)
cmc <- data.table(cmc)
cmc[, LowPrice:=as.numeric(Low)]
cmc[,PriceDate:=as.Date(Date, "%b %d, %Y")]
ggplot(cmc, aes(x=PriceDate, y=LowPrice))+geom_point()

Coming up
This course will cover the basics of R over a series of 9 lessons. We began with some essential techniques (in the first 2 lessons) and I will take you on a tour of some of the more advanced features of R with worked examples that have a Cryptocurrency and Steem flavour.
Data Wrangling occupies a significant portion of any Data Analysts time. The next tutorial will extend this Web Scraping Tutorial to look at more advanced data wrangling with R.
Curriculum
For a complete list of the lessons in this course you can find them on github. Feel free to reuse these tutorials but if you like what you see please don't forget to star me on github and upvote this post.
Related Posts
- Lesson 1 Introduction to R
- Lesson 2 Finding Your Way Around R
Thank you for reading. I write on Steemit about Blockchain, Cryptocurrency and Travel.
R logo source: https://www.r-project.org/logo/
Thank you for your contribution.
Thanks for your tutorial, it's very well explained.
Good job!!!
Your contribution has been evaluated according to Utopian policies and guidelines, as well as a predefined set of questions pertaining to the category.
To view those questions and the relevant answers related to your post, click here.
Need help? Write a ticket on https://support.utopian.io/.
Chat with us on Discord.
[utopian-moderator]
Thanks @portugalcoin
Hey @eroche
Thanks for contributing on Utopian.
We’re already looking forward to your next contribution!
Want to chat? Join us on Discord https://discord.gg/h52nFrV.
Vote for Utopian Witness!
cool, thank you for this. I have done web scraping before using excel and power bi. The only problem is now I have 3 tutorials to catch up on. Fear not, i have actually parked time next week to do these and I am really looking forward to it.
I am sharing this tutorial off steemit, I think some people I know will be interested in this
Fantastic.
Really very useful in your summary through this paper, maybe from here I have to learn more with extra time so I find more understanding of this data R.
Let me know if you have any questions. I find R really useful for quick scraping.
There are a number of software solutions that allow you to extract, export and analyze various data. Here you can find one of the best solutions web scraping services USA. All this data is useful for finding potential customers, collecting information from competing companies, identifying market trends, marketing analysis and more.