Learn Bitcoin-Python #2 - Bitcoin Price API & data visualisation

Hi Guys,
This tutorial is in continuation of the "Learn Bitcoin through programming with Python " series.
Please visit Part 1 below:
Utopian - https://utopian.io/utopian-io/@abhi3700/learn-bitcoin-python-1-installation-guide-basic-commands
Steemit - https://steemit.com/utopian-io/@abhi3700/learn-bitcoin-python-1-installation-guide-basic-commands
Bitcoin Price API
Here, we fetch the Bitcoin-price using an API provided by Coindesk.
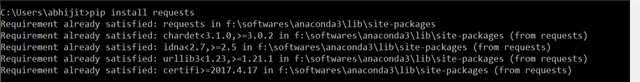
Tools required - Requests library. For more, click here.
Install from the 'cmd' using pip install requests -
Let's get started with the coding part-
Open notebook.
import requests
r = requests.get('https://api.coindesk.com/v1/bpi/currentprice.json')
print(r.json())
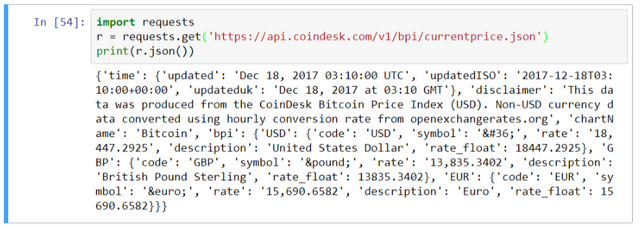
This displays the complete json data.
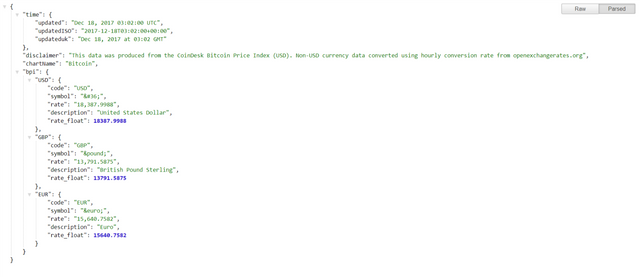
The complete json file looks like this. Click here -
Now, to get the price, we need to fetch the 'rate' parameter inside 'USD'. Follow the steps -
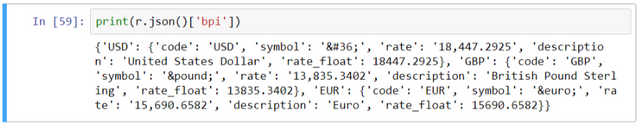
- Fetch the 'bpi' data -
print(r.json()['bpi'])
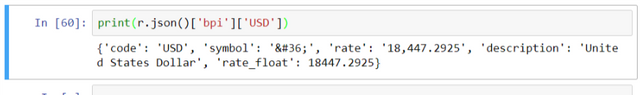
- Fetch the 'USD' data -
print(r.json()['bpi']['USD'])
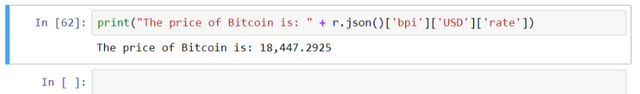
- Fetch the 'rate' value -
print("The price of Bitcoin is: " + r.json()['bpi']['USD']['rate'])
Now, let's jump on to the next section which is in more details i.e. Price data visualisation.
Bitcoin data visualisation
Here, we will look at the graph of the Bitcoin Price from day 1 to current date. For this, we will fetch the data from Coindesk in csv format.
Tools Installation
Following tools required for this:
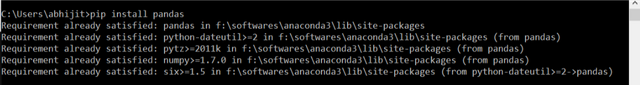
Pandas- for reading the csv file data.
pip install pandas
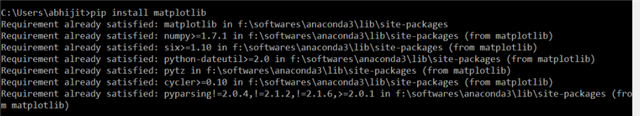
Matplotlib- plot the data.
pip install matplotlib
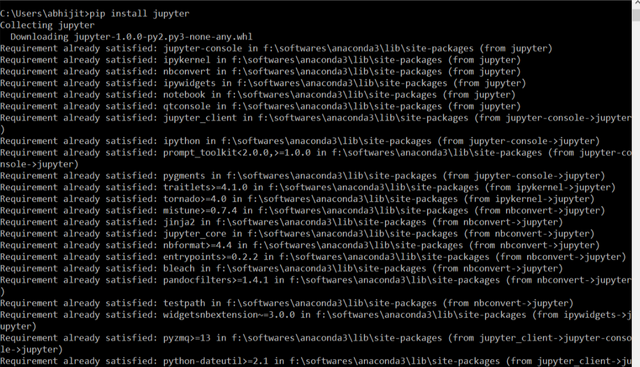
Jupyter notebook - writing commands for data visualisation.
pip install jupyter
Download the csv file.
Click on the 'Export' button on right side of the graph. And 'save as' in 'csv' format in the directory of the notebook editor file.
Coding
Now, open the notebook and start writing commands as follows:
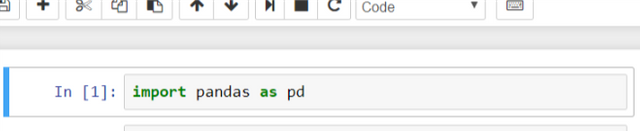
- Import the pandas library
import pandas as pd
- Import the matplotlib library
import matplotlib.pyplot as plt
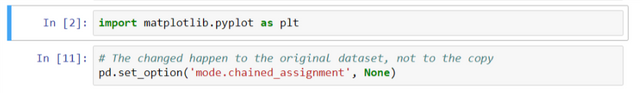
- Plot the graph inline. Also, we need to to make the changes to the data onto the original set, not onto the copy.
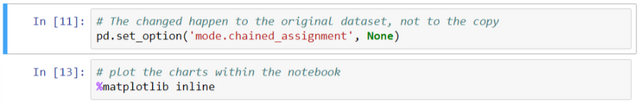
# The changed happen to the original dataset, not to the copy
pd.set_option('mode.chained_assignment', None)
# plot the charts within the notebook
%matplotlib inline
- Data manipulation
# Reading the csv file using pandas
price = pd.read_csv("coindesk_data.csv")
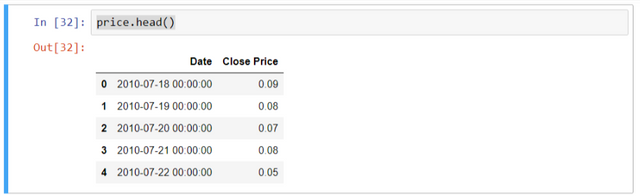
# look into the first 5 rows of the data.
price.head()
Now, let's get some info about the data.
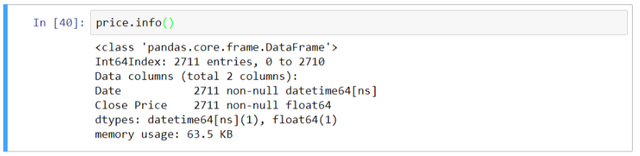
price.info()
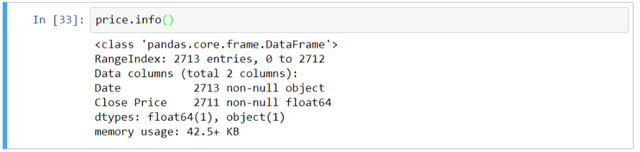
Here, we have 2 columns i.e. 'Date' - 2713 entries and 'Close Price' - 2711 entries. Now, we have to look at the 'Date' entries which has 2 extra entries. Also, the 'Date' entries is of type 'object' which needs to be changed into date-format.
Now, look at the data from bottom.
price.tail()
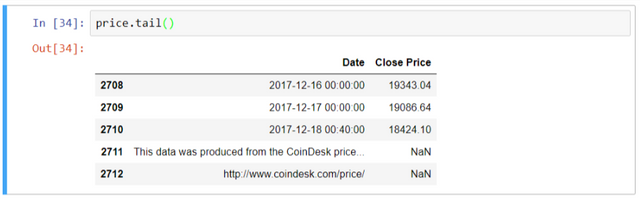
We find here that the last 2 rows have Close Price value as 'NaN', which needs to be deleted.
Use price = price.dropna() method for this.
Just check that the data is removed.
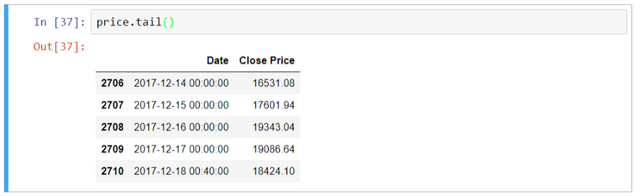
So, the last 2 rows have been removed.
Now, we need to convert the Date entries into date-format.
price['Date'] = pd.to_datetime(price['Date'], format = '%Y-%m-%d')
Now, to check if implemented. Use this method price.info()
Here, we can see that the Date column has entries of type 'datetime'.
Now, we have to set the Date column as index column.
price.index = price['Date']
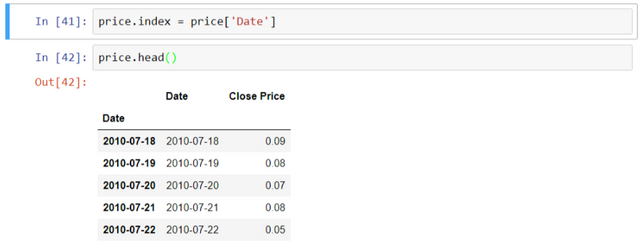
Here, we see that the previous Date column is also present.
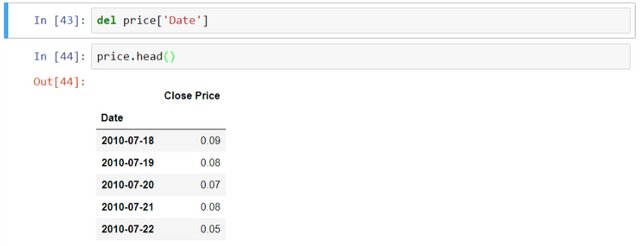
So, we need to delete that using del price['Date']. Now look at the output.
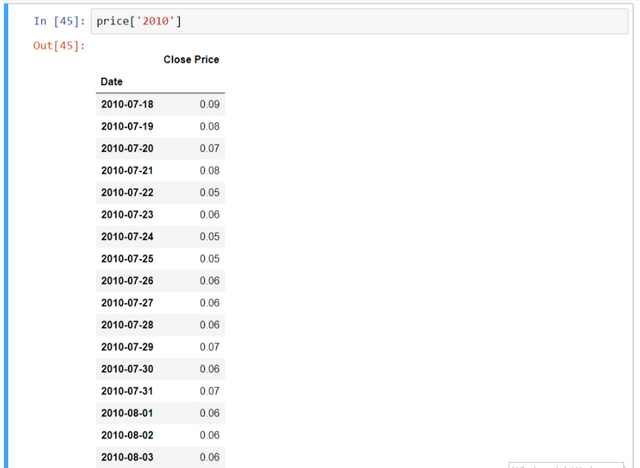
Now, we can see the price of the year 2010 using price['2010']
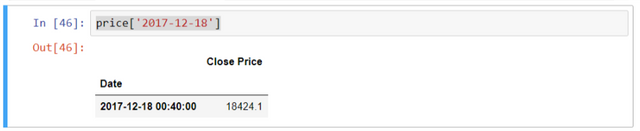
If we want to see the price on a particular date, use this method price['2017-12-18']
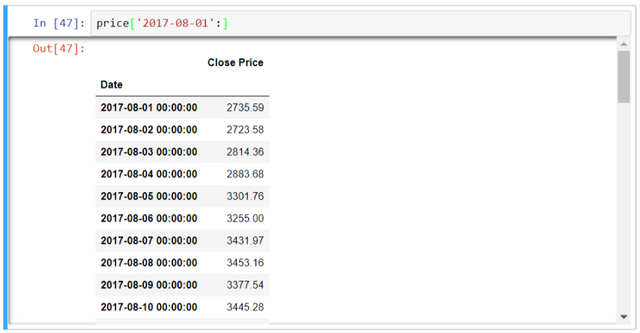
Now, to get the price from a date till current date, use this price['2017-08-01':]
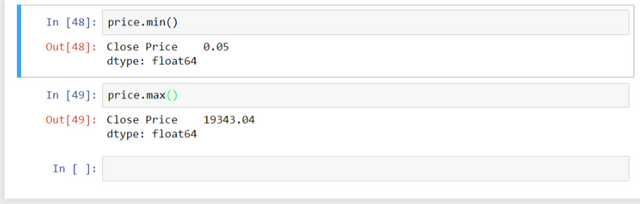
Now, to see the min. and max. price, use these commands - price.min() & price.max() .
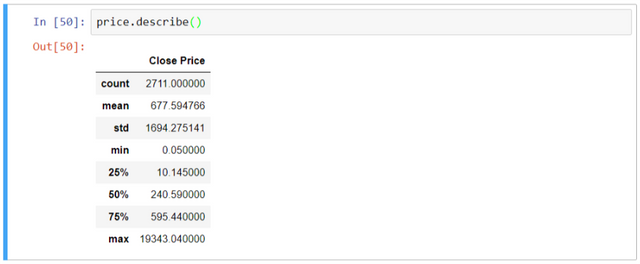
To know everything at a glance, use this syntax - price.describe()
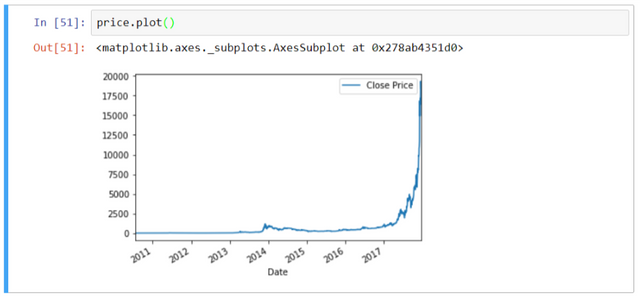
Now, plot the graph of Price vs Date . Use price.plot()
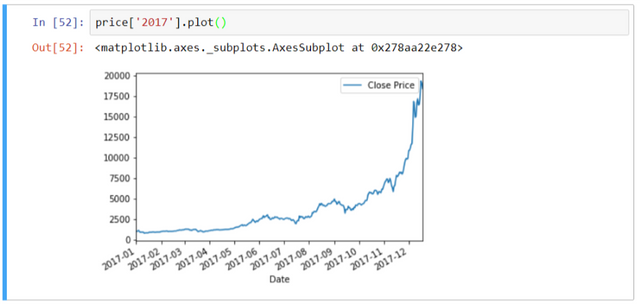
Now, to plot the graph for the year 2017, use price['2017'].plot()
That's all for now...
Stay tuned for more such tutorials.
Follow the series in Github
Posted on Utopian.io - Rewarding Open Source Contributors
Interesting!
Does mathplotlib supports different type of charts, like candlesticks, if yes, it is easy to get weekly candlesticks?
What about technical analysis, do you have to code yourself say bollinger bands to plot them on the chart, or is this already part of matplotlib?
Awesome, I've done some analysis with python and have pretty good results, check my blog on steemit. Keep up the good work.
Saya sangat menyukai posting anda
Thanks @tjunaidi
Thank you for the contribution. It has been approved.
You can contact us on Discord.
[utopian-moderator]
Great post!! Very cool way to combine the two topics!!
Hey @abhi3700 I am @utopian-io. I have just upvoted you!
Achievements
Suggestions
Get Noticed!
Community-Driven Witness!
I am the first and only Steem Community-Driven Witness. Participate on Discord. Lets GROW TOGETHER!
Up-vote this comment to grow my power and help Open Source contributions like this one. Want to chat? Join me on Discord https://discord.gg/Pc8HG9x
Good One Bro ! :)