USDJPY

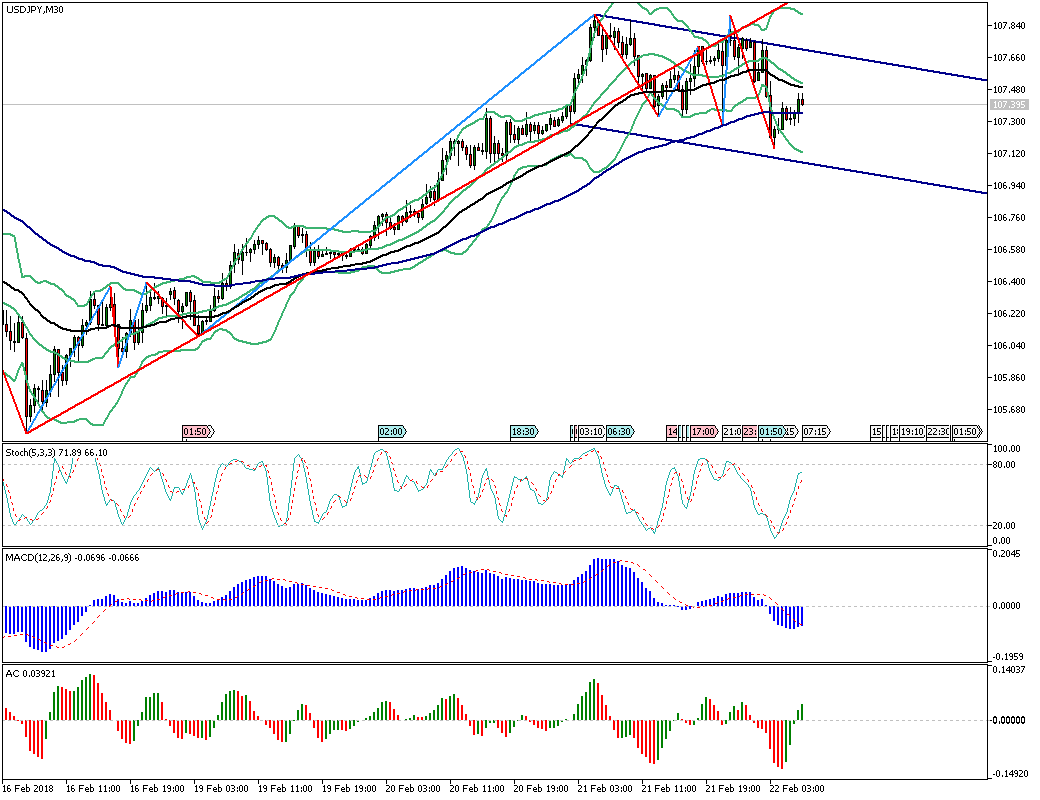
USDJPY 30 mint chart right now break the triangle down said. Now create down said channel so sell time now .
Now price in usdjpy 107.40 I think right time in sell but trade in with stop loss 107.70 and it's target 107.00,106.80.

USDJPY four hourly chart previous triangle break move in continue right now.
Last rally fibonacci retracement 50% level touch now down said move start again.
When break 107.00 level so down said strong support level 106.30 i think today touch.If down said channel up said line break and with break up said level 108.00 so buy buying call.
So up said draw in red line in resistance then break red line i think USDJPY very high levels touch 110.00,111.50,113.00.&115.25.
This post has received a 0.12% upvote from thanks to: @alitarar.
For more information, click here!!!!
Send minimum 0.010 SBD|STEEM to bid for votes.
Do you know, you can also earn daily passive income simply by delegating your Steem Power to @minnowhelper by clicking following links: 10SP, 100SP, 500SP, 1000SP or Another amount