An introduction to scripting in Tradingview!
Today we will look at some of the possibilities that come with Tradingviews scripting language, called Pine. It enables you to create your own indicators, mix several indicators up and even to write and test your own strategies.
In this part we‘ll take a look at some simple indicator scripts you could write. The good thing about Pine is that it comes with several built-in indicator-functions like rsi() or sma().
RSI:
The RSI is an indicator that can help you identify oversold or overbought markets and it can help you identify reversing momentum. Generally speaking, a RSI-value of 70 is interpreted as a overbought market and a value of under 30 is interpreted as a oversold market.

SMA:
The SMA is just the simple moving average of the last x values. It is used in chart analysis as a way to identify potential resistance and support levels.
The scripting:
So we start by selecting the Pine-Editor and writing the following

So, what do we have here?
First we declare the study() function where we are able to set some of the studies properties. The only things set in this example are the title(„ema“) and the overlay property, which, when set to true, will add the indicators on the chart. Otherwise it‘ll create a new chart below the price chart.
After that we declare a variable(l1) which holds the exponential moving average(the ema() function) for the last 21 days. After that we call the plot() function, that takes in l1 as first argument and the linewidth as second argument. Plot will now draw the graph of the exponential moving average for the last 21 days on the chart.
We repeat that twice with the respective values for the 50 and 200 sma. If we click „Add to Chart“ , we‘ll get the following.

After that we type the following.

Here we define a variable named mark that calls the crossover() function, which evaluates to true if argument one(closing price) crosses over argument two(l2, the 50 sma). Furthermore it checks if the rsi() is under 65.
Now we call the plotchar() function, that let‘s us put characters on the chart. We pass it the mark variable as argument number one. Then we define which character shall be plotted and its size and color.
So now when we click on „Add to chart“ we‘ll see big B‘s everywhere where the price crossed over the 50 sma and where the RSI is under 65.

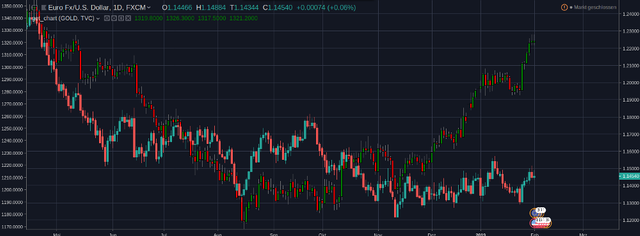
Let‘s look at another example. Say we want to plot a different price chart on the chart we are using right now.

First we call the study() function like we did before. Here we set overlay to true and tell the study to use the left scale for the indicator.
Now we define a variable containing the input for the symbol we later want to use. A symbol is an abbreviation for a stock or a tradingpair like EURUSD is the symbol for the Euro-Dollar trading pair. Defval defines a default value to be used, which in this case is GOLD.
The input() function let‘s the user of the script change the symbol from GOLD to one of his choosing.
After that we simply define four variables which basically all serve the same purpose. We call the built in security() function which let‘s us get the data for another symbol. As first argument we give the function the value stored in sym, which is the symbol name. Then we tell it which timeframe we want the data for. We choose „D“ for daily. Other options would be „W“ for weekly or „120“ for 120 minutes.
The last argument is the data we want to have. This is the only value that differs in each of the variables, because we want to have the close, open, high and low price. All of these keywords are built in variables.
Now we call the plotcandle() function to give us a chart with candlesticks. We have to pass it the values in this order open, high, low, close. The last argument that we'll pass to the function is the color.
Here we use a so called ternary operator which is a way to realize conditional statements in Pine.
It simply says the following:
If expression before ? Is true then do whats after ?. Otherwise do what‘s behind :
We check if the closing price is greater than the opening price. If it is, the bar will be green. Otherwise it will be red.

So that‘s it for todays introduction. Next time we'll look at the gator indicator;)