What is the Order-Book?
An introduction to the order book, one of the most important tools of the trader, besides the candlestick charts.
In several tutorials we talked about the candlestick chart, trends, indicators and chart patterns. All of these tools for assessing past and estimating future price movements are also regularly used in price analyses.
Trades - the basis of all charts
But how do the above signals come about? As indicated in the tutorials, these are based on the supply and demand for a certain investment: If demand increases, the price increases.
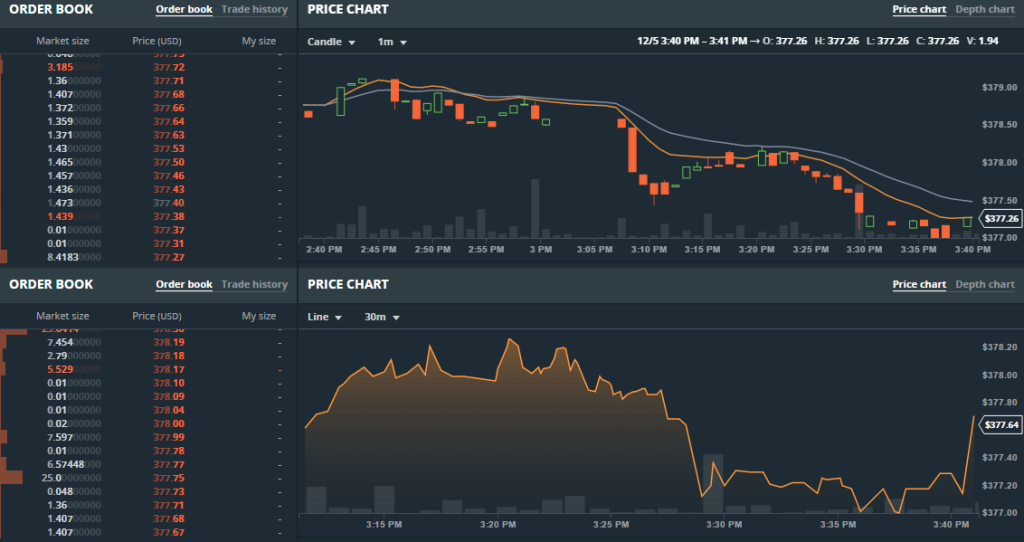
More concretely and even more radically, charts, patterns, trends and indicators emerge from the constantly running buying and selling of an asset - in other words, from the course of the individual transactions. On most exchanges, as shown here in Bittrex, this process can be studied in real time:
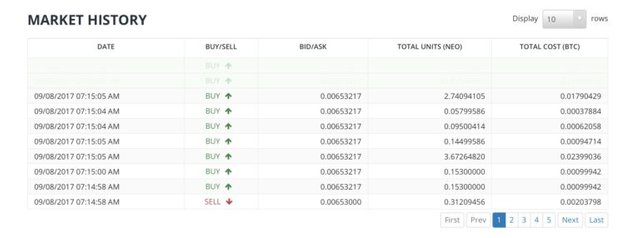
We can see here at the time of the admission several purchase orders were closed and the current price of the asset was slightly increased.
Order-Book - for what price would I buy and sell?
Even in this rudimentary representation, it is possible to go one step further: How do purchases and sales occur and how do prices develop? A buyer must have an idea of the price at which he is prepared to invest in a security. The same can be said of a seller: at what price is he willing to part with his investment?
People who only want to get into or out of a course quickly like to buy and sell at the best price for the opposite side. Accordingly, many people jump up at the last price or sell their investment.
If that were all, all purchases and sales would be equal to the last price - if there is any trade at all. The price would not change altogether at all.
There are, however, other parties on the market:
- Buyers who are convinced that the asset is undervalued and therefore want to enter the market as quickly as possible - even at a price that is higher than the current market price.
- Buyers who believe that the price is currently overvalued but are willing to buy at a price below the current market price.
- Sellers who consider the asset to be currently undervalued but consider a certain price level above the current market price to be acceptable.
- Sellers who consider the asset to be overvalued and are willing to sell at a price below the current market.
Finally, the exchange partner's volatility must also be taken into account. This may still be relatively stable in barter transactions between a cryptocurrency and Fiat, but for value pairs such as ethereum/bitcoin, a price increase of bitcoin can lead to a relative loss of ethereum.
These parties are acting together. Each has his or her own plan, his or her assessment of the real value of an asset, and his or her time scale, which he or she takes into account in his or her analyses and decisions.
By the way, one can learn here that trading wisdom, that a good trade always loses the opposite side, that you make profit at the expense of market losers, is not enough, because it assumes that everyone has the same intention in the same window of time. Less abstractly, a daytrader will judge an asset differently from a long-term investor.
Back to the order book: The various parties mentioned above can generate buy and sell orders independently of the market price or respond to already existing answers. An order book then looks like this:
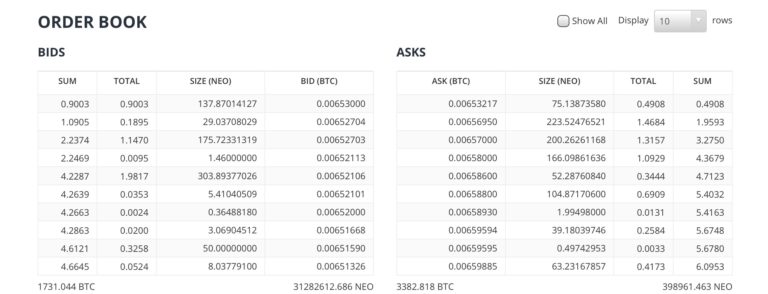
As you can see, a distinction is made between Bids and Asks. Bids are the purchase prices which buyers of the above mentioned second group are willing to pay. Asks are complementary to the selling prices, which sellers of the third group find acceptable.
Market participants in the first or fourth group are generally people whose positions are readily and quickly accepted by exchange partners. These are very lucrative deals for the trading partner, some of which are already available as positions, i. e. Ask or Bid. The purchase and sale prices are given in the pair of values in BTC.
In addition to the bid and ask prices, the quantity of the asset to be traded for a particular price is listed in these lists. Under "Size (NEO)" you can see how many NEO tokens are bought or sold in BTC for the price given under Bid or Ask.
The equivalent in BTC for this sum of NEO tokens is called "Total", while a cumulative sum is calculated under "Sum". For the bid prices, this cumulative sum is calculated by adding the total values of all the more expensive bid orders to the total value of the price in question for a given price. Similarly, in the case of Ask prices, the sum of all total values for cheaper Ask orders and the total value of the considered Ask orders is calculated.
For example, for the bid orders of people who would buy NEO for a value of 0.00652703 BTC, the sum of the total values for the bid orders themselves, 0.00652704 BTC and 0.006530000 BTC, is formed. Assuming that many sellers like to sell quickly, they will want to serve the highest bid value.
Therefore, it can be assumed that before a sale of NEO at the price of 0.00652703 BTC, only the BID order in which NEO are sold at the price of 0.00652704 BTC and 0.00653000 BTC can be assumed. In the example above, according to the value for Total, NEO must first find 1.0905 BTC buyers.
Buy and sell walls - what the Market Depth tells you
Even if such a representation lists the concrete bid and ask orders sorted, such a representation is not to be grasped fast. Therefore, a graphical representation of the order book has become established, which is known as Market Depth or Depth of Market.
The Ethereum/Bitcoin value pair is considered as an example here, since it illustrates an important benefit of this graphic representation. For the graphical representation, all "sum" values of the bid and ask orders are plotted above the respective price in BTC. The result looks like this:
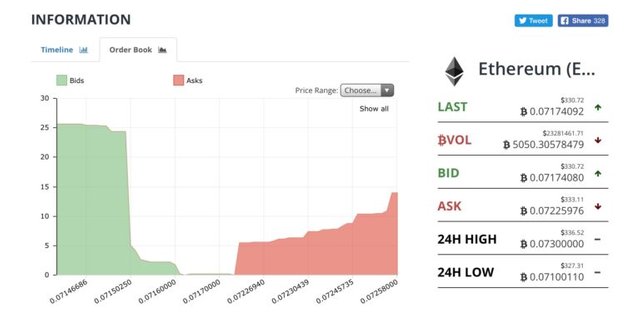
You can clearly see with a bid order of 0.07150250 BTC the total, i. e. the cumulative sum of all orders, is increasing rapidly. This is called a Buy Wall. It will be difficult to undercut this price because a lot of orders have to be fulfilled before that is possible. Something analogous can be found in the Ask orders, here we speak of a sell wall. Great sell walls keep according to the price down.
Of course, it should be emphasized here such walls can also be set consciously. Especially for smaller Altcoins, there are many big players on the market who want to set the appropriate walls by placing large orders and thus control the behaviour of the other traders. This process is known as spoofing. Similar to support and resistances, these walls are of course not a 100% guarantee that the price will evolve in this or that direction, but they can support a decision to buy or sell.
Thank's for reading!
I would be glad if you upvote and resteem my content, if you like it...
Follow Me: @skyrockzzz

Resteemed to over 4000 followers and 100% upvoted. Thank you for using my service!
Read here how the new bot from Berlin works.
@resteem.bot
Thanks for this post. Good inside.
Thanks for your feedback!
It's helpful for someone who wants to trade like me.
This post recieved an upvote from minnowpond. If you would like to recieve upvotes from minnowpond on all your posts, simply FOLLOW @minnowpond