Alcoa (AA) Price Analysis
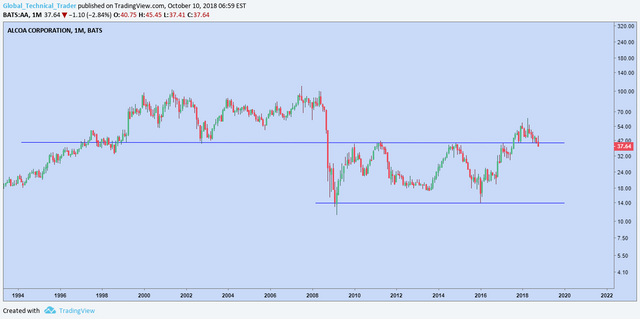
The long term chart of Alcoa has take serious damage should it stay below the level that has provided support and resistance, all the way back to the late 1990's. It has spent over a year above the breakout area, a length of time that suggests there is plenty of stock to be sold given the move has failed.
The daily chart, as seen below, shows the stock entered a consolidation zone on 19th July as it traded significantly lower on increased volume. That consolidation has now broken to the downside suggestive of lower prices.

Price needs to regain the 40 level to negate the bearish view. Else I would be looking for a protracted decline.
Howdy @technicaltrader,
We Love You and All You Do Here.
Thank you for using the STEEM Network.
We gathered some statistics about your posts, you should find interesting.
Average Votes Per Post: 0.85
Average Replies Per Post: 0.25
Average Post Word count: 136.4
Follow us for future benefits. Delegate some STEEM Power 1SP, 5SP, 10SP, 100SP, or Donate to Help Support
Warm Regards,
@WeLoveYou.
We can also resteem and upvote more of your posts
Learn More, Read Our Introduction
If your reputation is lower than 30 resteeming with @WeLoveYou only costs 0.001 SBD