bitcoin - 1H Chart - Probando cortos - Bearish
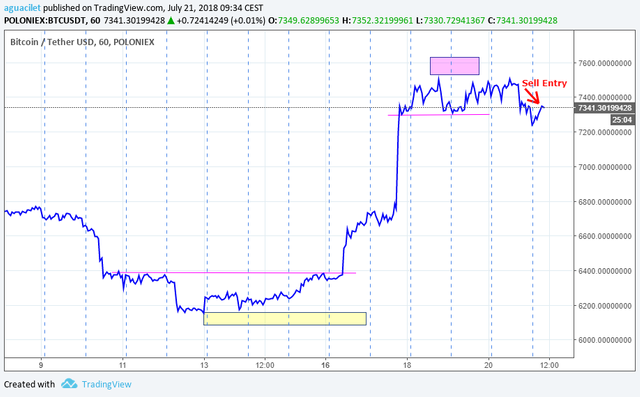
Es hora de probar el lado corto. Aqui podeis ver un gráfico de 1 hora, y además se ve muy claro el proceso de acumulación de órdenes, lo que nunca sabremos es si esa acumulación es para continuar con la subida o para girar cortos... esto es siempre asi. Yo, participo y pongo mi stop loss, controlo el riesgo que es lo único que puedo controlar y lo demás se lo dejo al mercado. La entrada corta se ha abierto en 7340 con Stop Loss en 7550.
It's time to try the short side. Below you can see a 1 hour chart, and also it is very clear the process of accumulation of orders, what we will never know is whether that accumulation is to continue bullish or to turn short ... this is always the case. I, participate and put my stop loss, I control the risk that is the only thing I can control and the rest I leave it to the market. The short entry has been opened at 7340 and Stop Loss is at 7550.