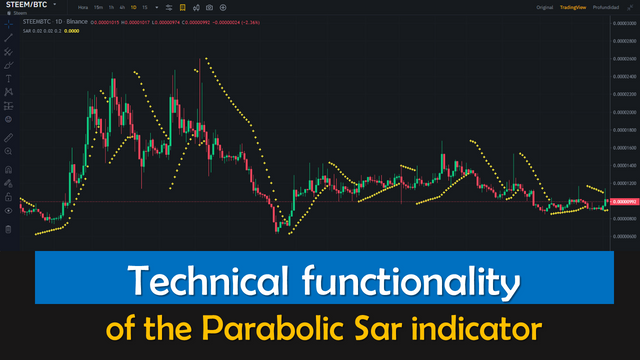
Technical functionality of the Parabolic Sar indicator

Introduction
In the cryptocurrency market, determining when an uptrend, or downtrend, has ended is one of the situations that most concerns people who trade by buying/selling.
Now, there are technical tools that serve to give us an orientation of the direction and trend changes, among these one of those that I have been particularly testing is the Parabolic Sar indicator, since it is one of those technical tools that can be used to deduce the probable behavior of the trend.
I would like to emphasize that, based on the bibliographic references consulted, it is important to consider some important elements of the Parabolic Sar indicator, which reflects a set of price data with statistical projection, which allows us to know the market trend.

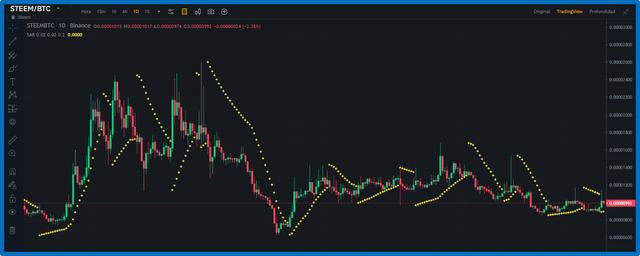
On the other hand, the PSAR allows to determine when a trend will end, or when it is closer to ending, and at a graphic level the Parabolic Sar indicator is a series of points that appear above or below the price, which serve as a guide to make entry or exit decisions at a certain time and market action.
In the next post, I will share some ways to use the Parabolic Sar indicator at certain times of price action.

SOURCES CONSULTED
➊ Casey Murphy Introduction to the Parabolic SAR. Link

OBSERVATION:
The cover image was designed by the author: @lupafilotaxia, incorporating image: Screenshot from Binance portal

