How can we execute trades with a better view of price action?

Introduction
A prerequisite for success in the world of traditional financial markets and specifically in the cryptocurrency market, is to design and establish effective trading strategies, therefore, any user who wants to get more hits than misses, must build strategies that reduce the risk of losses and therefore provide a higher percentage of profits.
However, in order to build effective strategies, the first thing to do is to explore and study as many indicators and technical tools as possible, in order to use the ones that best suit our level of understanding, which will allow us to execute trades with a better view of the market.
Based on the above, it should be emphasised that in the world of trading there is a wide range of indicators and technical tools, which support the design of strategies and investment models, but each of these indicators and tools have certain advantages and disadvantages, so before deciding to use any indicator or trading tool, the idea is to investigate the technical fundamentals involved.
In this sense, and considering the academic literature, the aim of this publication is to describe in detail the Heikin-Ashi Technique, in order to present in an orderly manner the theoretical foundations of this technique, and how it can be used within our trading strategies.
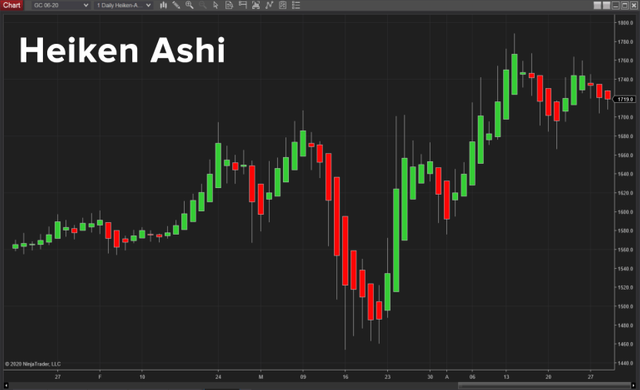
From the operational point of view, the Heikin-Ashi technique is usually used as a very effective tool for identifying the trend that is developing in a given financial market. Additionally, the novelty of this extraordinary technique is that each candle is built from the average values that the price action is forming, hence, unlike the traditional Japanese candlesticks, the Heikin-Ashi technique is identified as a tool that helps to filter market noise.

When I mention that the Heikin-Ashi candlesticks are constructed from the average values formed by the price action, it is because they are based on a modified formula based on the two-period moving averages, additionally each Heikin-Ashi candle is formed with the data of the previous candle, namely; opening, closing, maximum and minimum prices of the previous candle.
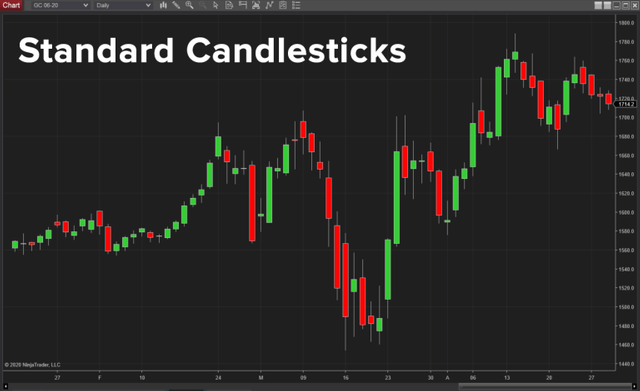
When looking closely at the Heikin-Ashi candlesticks it exhibits a very smooth appearance in comparison to the chart on the left which corresponds to Japanese candlesticks with a slightly more complicated appearance which tends to distort the visibility of the pattern.

Another visual difference is that in traditional Japanese candlestick charts, each candle starts at the closing level of the previous candle, while in Heikin-Ashi candlestick charts, each candle starts from the middle segment of the previous candle.

SOURCES CONSULTED
➊ Cfi Heikin-Ashi Technique. Link

OBSERVATION:
The cover image was designed by the author: @lupafilotaxia, incorporating image background: Source EspacioBit

