Volume as a key statistical indicator in technical analysis

Introduction
Within trading, technical analysis is of vital importance, primarily because it uses elements of the scientific method to record an actual history of the movements of price action or a given market, and then uses that data to create charts that serve to evaluate and extrapolate trends in the financial markets.
Basically, technical analysis is based on the statistical values developed by the price action when creating trends, that is to say, it is based on a balance between supply and demand. In this sense, I must point out that one of the key statistical indicators within technical analysis is the Volume Indicator.
It should be emphasized that volume is one of the oldest and most reliable trading indicators used in trading the financial markets, and I would even go so far as to say that the volume indicator is the most popular indicator in the trading world.

When I say that volume is the most popular indicator in the trading world, I mean that any trading portal, platform or broker may not have a specific indicator, however, I am not aware of any platform that does not have a volume indicator.
Theoretically, volume is understood as the measure of the amount of a given asset or financial instrument that has been traded in a given period of time, which is why it is used as a technical indicator, since it serves to project the strength that has been marked.
In addition, volume is also used to know the price action both in bounces and in specific setbacks within a given time frame, therefore, the volume indicator gives us an indication of the strength or weakness of a movement, an element that allows us to deduce whether there is buying pressure or selling pressure.

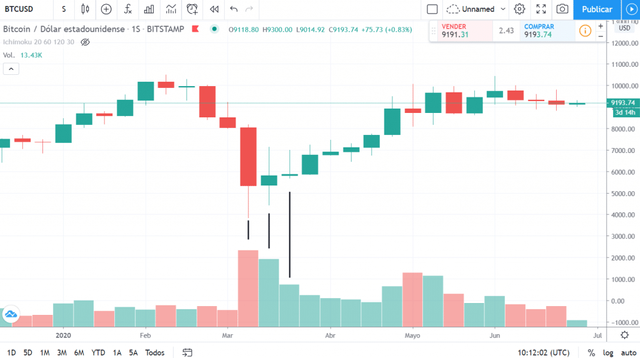
The volume indicator is usually represented by a succession of columns of different sizes, where each column is the time of the time frame in which the market is being traded (i.e. 1 hour, 4 hours, 1 day, 1 week, 1 month, etc.).
Finally, it is important to note that the size of the columns reveals either high or low trading activity in a given period. Another element to highlight is the color of the columns, with green being assigned to columns with a higher projected volume than the preceding trading, and red to columns with a lower projected volume than the preceding trading.

SOURCES CONSULTED
➊ Steven N Using Trading Volume to Understand Investment Activity. Link
➋ Jake F Fungibility. Link

OBSERVATION:
The cover image was designed by the author: @lupafilotaxia, incorporating image background: Author: Criptotendencia

