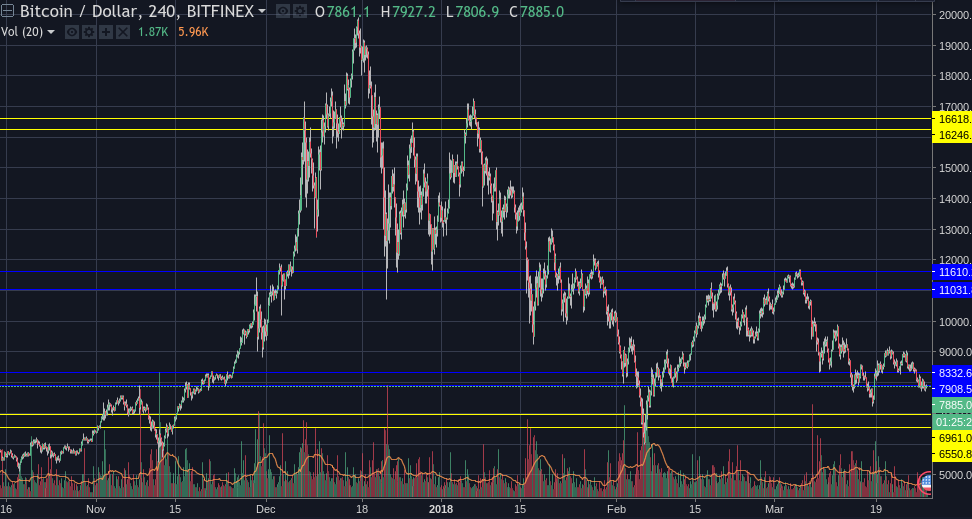
TA Strategy on 4h chart, based on resistance and support zones.
The pips, the sats and the 4h charts.. Strategy on 4h chart, based on resistance and support zones.
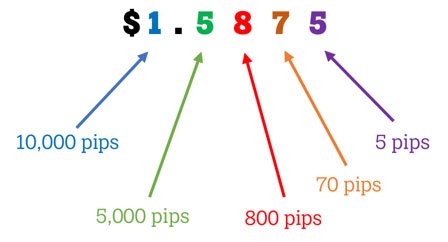
Remember any ForEX enthusiast that screams ‘bring me the pips’ :P It was a common thing for me to correlate in my mind pips to sats. For the sake of clarity, a pip stands for ‘percentage in point’ and is the smallest/minimum price movement of a currency pair’

For example, in the USD/JPY it is 0.01 and in the GBP/USD it is 0.0001. A pip is then worth $10, $1 or $0.1 And you then trade based on volume instead of margin, similar to what we often do with alts. You can find also lots called standard, mini and micro depending on the size, names we often use in OTC trading as well.
.. Sounds familiar?
In foreign exchange trading we use pairs as well. In other words, the / you see in crypto. The base/quote , where the base is same idea as in crypto, the units of coins needed to buy in order to form 1 quote coin. How many btc you need to buy, to form 1 trx. (Hopefully 0)
(---> in fact to sell to the exchange, to get the other coin. It is in the word itself, “exchange” of value)
Let’s move on.
Reason for this intro is basically a forex-common strat that you can apply and i love personally. I find it important mostly because the current TA all around seems a bit conflicted. I am quite relaxed, and let me share with you why and i am waiting for your opinions and strategies yourself. Let’s discuss.
Once you realise in day trading how to chase sats instead of fiat value,you will most probably see your portfolio growing. SO why do we like 4h charts? You will see they will be shown to be worth more in sats value. The bigger the time frame the bigger the sats absolute value.
So let’s move to the actual argument i have as a rebound to current major TAs around. I see most keep chasing triangles. I know,we love triangles. But look at the market, we are stuck in zones instead of lines. So what if, you just drew common resistance and support zones instead of other formations, to eliminate false drops or inclines that can lead to panic trading or let’s be honest on a disturbed peace of mind and horrible psychology. Remember, trade without emotion but keep in mind we talk about behavioural economics.

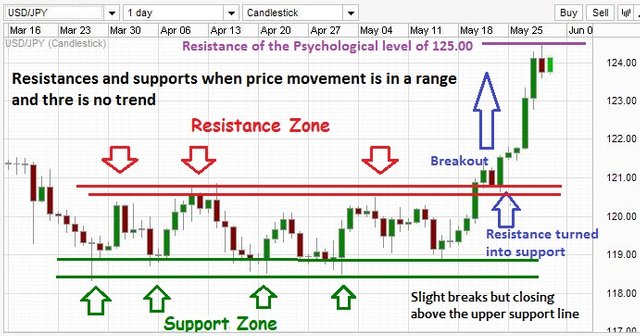
Identify your resistance zone : facts to remember, you find R when and where people sell when price goes up. In simple words, a ceiling, hence it is above the support. And it is also the point where you see an uptrend ending, for a while at least.
Resistance zone now, is a whole area and not a specific point. And generally speaking when you see a lot of volume in that zone , you expect the true R to be accurately found lower.
Support: Imagine it as your floor. It supports the house,hence it is lower than the ceiling/resistance. Now you see the opposite, a downtrend is about to end and the support zone is correlated to demand while resistance is your supply.
Now imagine in your house, one of this bouncing annoying balls that i loved throwing to my cousins. Its an example that is given to most of trading and TA talks, and there is a reason, it is the perfect analogy. The ball bounces up and down, left and right hitting walls and ceilings and floors and all in between. Can it go higher or lower? Yes, you might have a hole. But for the most part it stays where you have it, in the house, in the zone.
I do not ever draw R and S lines diagonally. Ever, not me. Not judging, do as you may, i just do not angle my lines at all. If I need to, I zoom out.
What we see lately, at least what i do , is past month forming resistance at approx 11.5k to support’s 10.8K, followed by 9.5k r to 7.8k support and this, only if we look on the monthly - the more you zoom,the more zones you will find, the more shorter time frame positions you care for. Zoom out on 3 month and you will see on average 11.5 resistance to 8.5K support, rounded numbers for your ease. Again, subjective and rounded numbers but you get the idea. The ball/price/value bounces up and down but until it breaks enough times the support and/oor resistance lines, i skip my day trading expecting high margin, i just consider it a no trade zone unless i want to hustle in extremely small time frames to make some gains when china wakes up. Moreover, do not forget that the highest volume of btc which is also the smallest % of holders, is not traded in the exchanges but out of them. And when it is put back in the exchange to be sold in chunks, price gets volatile and then it is taken out.

I personally said sometimes that i don’t expect btc to rise dramatically until summer even until the end of it, and to be blunt with you i do not even want it to be as aggressive. Bearish markets often last 6 months and June is often a turn point. Regarding the 4h strategy tho that i promised because i think i stretch the post too much;
You can do this on daily or weekly too, we like 4h though as it is a happy medium. Remember the numbers mentioned above? Find the mean. Then watch until value from bouncing almost horizontally goes up or down and keeps it for 5+ candles. Then , you will probably see it going sideways and staying horizontally some more people think, people wait, and then your rest of indicators should kick in to be ready before the break through / in case it is going up to a new support zone which was the previous resistance one, and if it goes downwards to the new resistance one that it was previously the support.
So to sum up what i am doing, i have the overall long term support and resistance zone, and if i want to day trade and put other indi pairs, i wait for the bouncing to go vertical almost, then probably stabilize for a while and then i check my indicators and of course order books to have a prediction on wether the market leans towards a breakthrough following the previous incline or decline, or if it will do the opposite. And put in this cake the cherry of FA, and you will potentially have various confirmations for your desired prediction.
Remember also, the only chart that never lies, is the one of the past. So, trade carefully and responsibly as well. Much love and have a great week !
B.
Very nice, Will be looking forward to your posts. Up-voted: hope you will visit my blog
thank you for the feedback, I sure will !
Thank you for the good post! If you interested in Cryptocurrency and the trending news about, you more than welcome to check out my page @southforce where I provide daily news on trending topics about Cryptocurrency!
always interested, will do thank you Force :)
Congratulations @ibetty! You received a personal award!
Click here to view your Board
Do not miss the last post from @steemitboard:
Vote for @Steemitboard as a witness and get one more award and increased upvotes!
Congratulations @ibetty! You received a personal award!
You can view your badges on your Steem Board and compare to others on the Steem Ranking
Vote for @Steemitboard as a witness to get one more award and increased upvotes!