Learning Technical Analysis: patterns basics
To start with saying I hope people do not freak out, at this point this week I stopped doing day to day Technical Analysis but focused on first of all brokering almost entirely and the actual market itself which is being simply put, re arranged. Long conversation and perhaps not for now, but I am relaxed, because it is a process much needed for circulation to remain healthy. But that is how I see it. With that being said, i will do the usual and talk about the exact opposite of what I just said, I am a girl like that :D
So let's talk about patterns and I will mention two today. Please let me know in the comments what your fav patterns are, and let's discuss !
First things first. In any given TA, you go hand in hand with the idea of assumptions. I heard people stating they do not prefer to follow patterns but the whole idea of TA is the assumption that past will repeat itself.
You judge your chart based on patterns that in the past indicated a specific outcome.The outcome is not definite, and the probabilities of being correct are high / but never definite/, there is always even a tiny probability of error.
There are two types of patterns, the reversal and the continuous ones ; Many might assume in the beginning that reversal ones occur when price declines but that is wrong, a reversal takes place when we see a change in the direction of the trend, be it a rally or a decline. I do not want to call it a correction because despite the fact we have the habit of correlating corrections to something declining, the correction is simply a reverse move that most often tends to be negative. Another footnote is that a negative correction is not the same with a bearish market or a recession due to its shorter timeframe.
Importance of reversal patterns ; apart from the obvious which is prediction of a change of a trend’s direction, reversals help a trader identify what strategy to pursue next. Consider it a prediction for a prediction, makes any sense?
Most common path for identifying an upcoming reversal is to look for serial new highs and lows.
Example : a daytrader uses 1-30m timeframe to identify a negative reversal in order to open a short position. He counts 7 continuous lower lows, could possibly shift from 5 to 15 min to confirm his indicators as discussed before, and opens a short to benefit from his assumption, if correct. To open a long, in this example the candles would have to reach continuously upwards after a downtrend. And so on.
I do not want to drag the post too much, so I will mention 3 .Let’s see some reversal patterns we often hear about. So we know how to identify them.
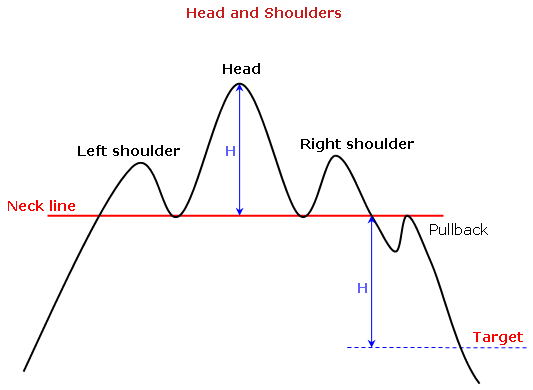
Head & Shoulders
We heard about it quite a lot lately. What is it?
As all reversal patterns, h&s indicates the trend is about to change.
See what is interesting about this pattern in the picture below. We identify the left and right shoulder as well as the head, no surprises here, head is above the shoulders or you would look really really weird.
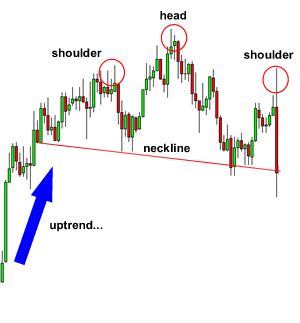
Notice what the writer states, downward sloping confirmation line is a stronger pattern than an upwards one. I want to hear your opinions on it.
People tend to use it for shorting predictions but to be honest, do what suits you. A pattern helps depending on how you perceive it , as long as it follows some specifics simply because they were seen and worked before.but if you use it for shorting (bet on the price to drop that is) do it as soon as the price moves below the neckline, after the drop from the right shoulder.

H&S for long positions? simply do the opposite, Inverse Head and Shoulders. First of all, wait for the pattern to complete. Do not rush. And you continue doing the opposite, instead of waiting for price to drop downwards towards the neckline after the peak of the right shoulder, do this : For the inverse head and shoulder,wait for price to go above the neckline after the right shoulder is formed. No exceptions here, enter upon breakout even though more nerve wrecking approaches can be seen for inception-like pullbacks after breakout.
Have a look below:
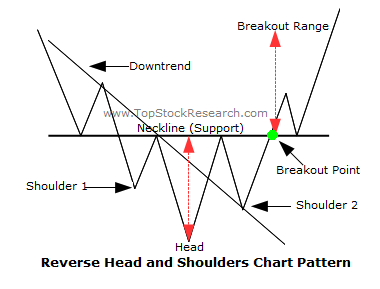
Stick to easy stuff, it is not a race of who understands it better. Enter upon breakout, and to identify the breakout , it is simply the point on the support (neckline) that price will touch last before starts moving upwards.
Note, inverse may be seen around as reverse. same thing.
Double top & Double bottom pattern
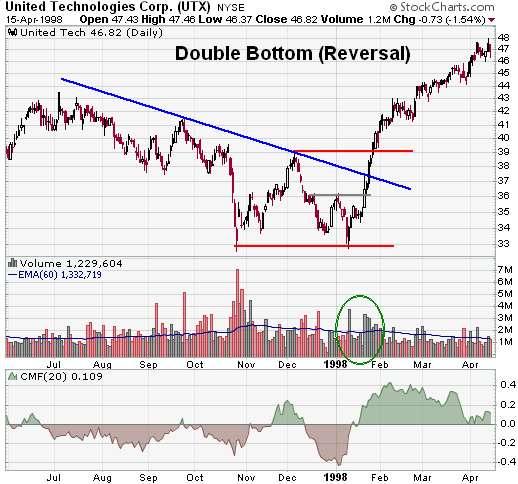
Both of them..Same idea, different reversal direction. Double bottom with a usual middle peak (pullback high) indicates that reversal will be positive. In other words, double bottom→ bullish
When ? moment you see a breakout point passing the the pullback high (the up spike as i call it for faster ref) and moving upwards you know the pattern is confirmed.
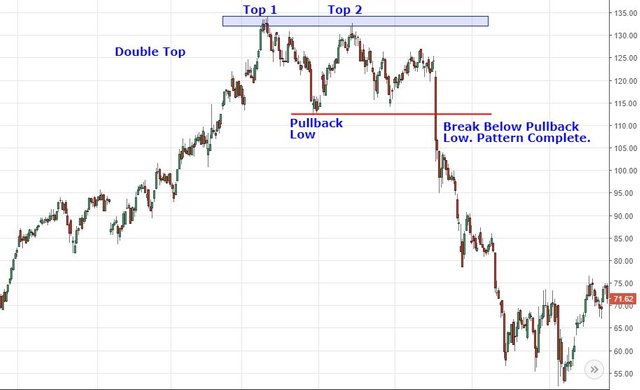
Alternatively, double top is the opposite. It is a bearish reversal pattern that instead of pullback high has as you accurately assumed, a pullback low (a bottom spike, as i like to call it) and the pattern is confirmed when price breaks below the pullback low.
The two patterns of the same family basically show that price makes a high or low and then pulls back. On the next incline it decline the price meets the previous high or low, and then falls below the pullback low or above the pullback high.
It's called a double top/bottom because the price touches the same point twice, and basically cannot break through the resistance or support line accordingly.
It’s easy, lets see again so we memorise !
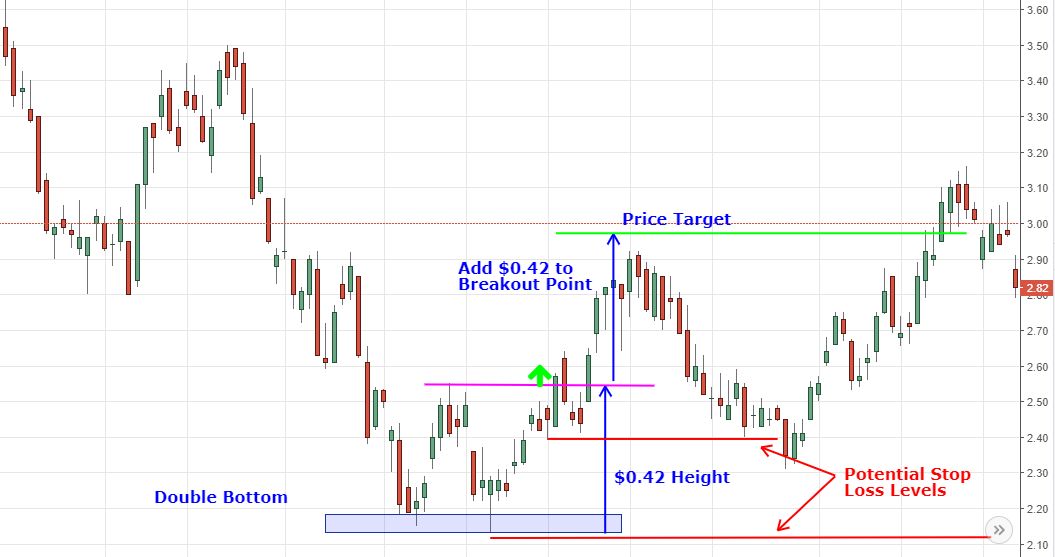
Double Bottom --> Bullish (what goes down goes up)
Use to: confirming long positions
R/S: bottoms do not go below support area
Calculate time ! : add the height of the pattern to the breakout point (imagine copy-pasting the height of the pattern on the breakout point. Your prediction is the double height in other words as price target)
Stop loss: i dont follow pic shown. What i do when i play with stop loss is i make sure it passes breakout point so i am at a profit and my stop loss is my breakout point +1. Many just go below that, i do not or the double pattern is useless and a waste of time.
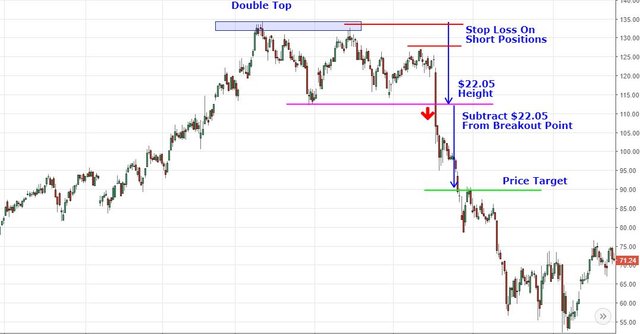
Double Top --> Bearish (what goes up will go again down)
Use to: open a short position or exit a long position
R/S: tops do not move above resistance area
Calculate time ! : height of the pattern subtracted from the breakout point. Meaning, same as on double bottoms, “copy-paste” your height and put it below the breakout point. That’s your price target.
Stop loss on short: forget about that, it is full of zig zags at this point you will mess it up. Short for your price target instead in total.
Please remember in double patterns the target may not be met. It is the expected range only.
See you soon x :)
B.
Added to my follow list. Keep up the good work and what do you think of the current market?
Hello , I am sorry for the delay I did not see it earlier. The market for me right now is being re arranged. I do not talk about the majority of exchange traders but the 1% that trades off of it. So I analyse it sliced in both TA and brokering. I am confident about the long run obviously but the current week is a no trade zone for me unless you want to open fast long and short positions to make a profit based on your personal volume.