You are viewing a single comment's thread from:
RE: Why I recomend 1hour candle charts, if your a new trader..
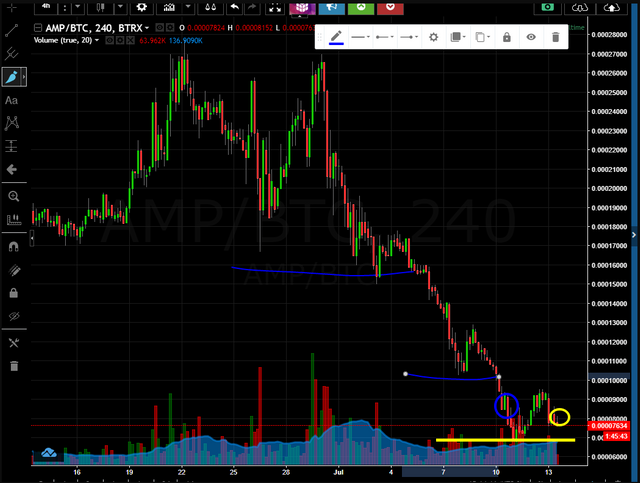
Hi luc !, thanks for the videos I am a beginner and I have a doubt: in the following chart, I draw two bases in blue, and then another in yellow.
According to I understand the ideal would be to buy in the blue circle but that time has passed, but which of the two options would be the best?
- Buy in the yellow circle hoping to keep going up.
- wait for a new crack well below the yellow line

The most important part of that chart is that the price didnt bounce back to the previous base, on the earlier bases.. so that means there is extreme weakness showing on that chart, and so I wouldn't trade it. I would find another chart thats safer.. unless you really really want to own AMP and you dont care if it falls further.. .. but please watch my previous video on Support and Resistance to get a clear picture of where to draw your safety circles..
Btw.. I am stuck in AMP now because of those crappy no bounce bases.. But I wont sell ofcourse until i get my bounce.. but I also wont buy it either, now that the chart has gone bad..
IM right there with you Luc, I made several buys on the downward trend and didn't bounce. I think I should have sold on the 93 bounce and would have broke even.
disappointing, but it may still bounce.. atleast im not going to throw more money at it