Weird lines also known as CANDLESTICK CHARTS
Hello fellow Steemians !
After a few months of lurking I finally decided to join the cryptoworld. I saw a few links that brought me here and I choose to stay.My account got approved recently and I'm ready to "Submit my first Story".
So,let's get it started!
![ ] ( )
)
I'm sure that most of you saw those weird green and red (or black and white) strange sticks.
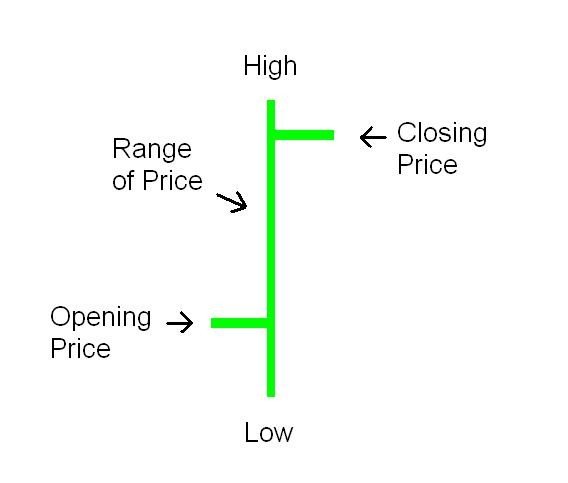
You might think that this makes no sense,why would you care about that? What if I told you that it's pretty easy to understand and it will only take a few minutes? The image above is a representation of a OHLC(Open-high-low-close chart) and it's pretty similar to a candlestick chart.
Let's try to read the chart:
This is actually a bullish price bar where the price opens at the tab represented on the left then it reaches a low point it shoot's itself to a high point and closes well above the opening price .
I hope you are still there,so "HODL" on.
Candlestick charts:
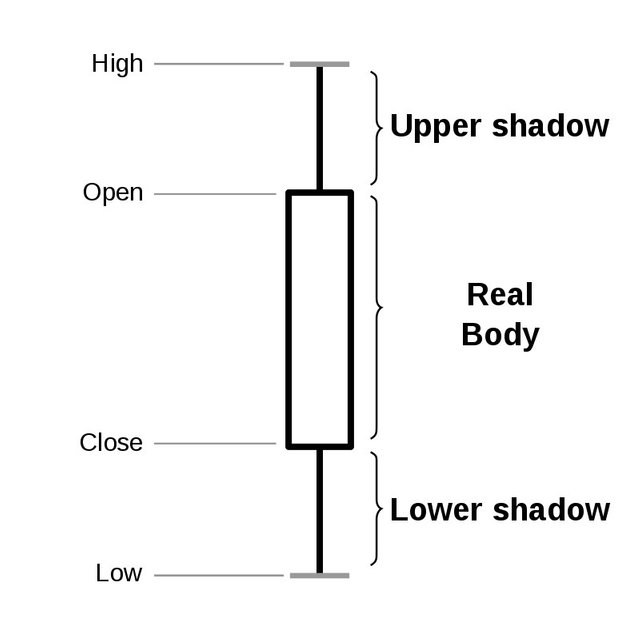
Now let's see something that you might already know from the trading platforms,an actual candlestick chart
![ ] ( )
)
***In order to create a candlestick chart, you must have a data set that contains open, high, low and close values for each time period you want to display
Yep,you are right.Candles look a little bit different but as I said,it's pretty easy to read,so keep calm and let's see:
- -Real body :the space between the open and the closing price
- -Shadow/Tail:the long thin lines above and below the body
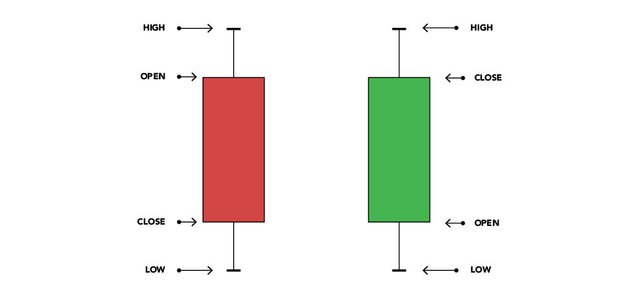
Candles will also be colored.Most often we use green and red but you might see other color schemes too.
- green = bullish
- red= bearish
I know,I know,I mentioned bullish and bearish so let's see what does that mean:
When it comes to trading the most important question is:Who has the power?
- bullish = The bulls(buyers) think that the prices would go up in the future and they keep buying
- bearish = The bears(sellers) think that the price will go down and they are trying to sell at the current price
So keep in mind and always ask yourself:"Who is in power?"
If you are able to understand this then you will be able to understand the market movement
Now let's see two candlestick charts,a bearish and a bullish one
![ ] ( )
)
On the left we can see a bearish candle.If we look at the differences between the two candles we immediately notice that one is red and one is green(What a good observation,right?).Now really,the main difference is that the bearish(left chart) opens at a price and it closes way under the opening price.A bullish chart closes above the opening price.A bigger body (the colored/solid part) means a stronger impact.
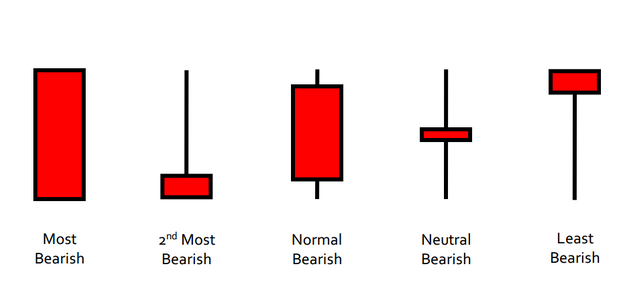
Let's see a few bearish chart examples
![ ] ( )
)
- The first chart is pretty clear in my opinion:we got an opening price and the bears are able to bring the price even lower,crushing the bulls.
- In the second example however,we can see that the bulls are able to push the price up,but then can't pierce through the huge resistance of the bears who reject higher prices,so they(the bears) manage to bring the prices down and close the chart in a winning position.
- In the 4th chart we can see a little body,meaning that the difference between the opening and closing price is not so huge.A candlestick without a real body(or a very small one) is also called a Doji and it might show the probability of a reversing pattern in the future(I will cover Dojis in the upcoming posts where I would like to get more detailed about specific chart patterns
- In the last pattern we can see that the bears were able to pull the prices far far below the opening prices,however the closing price was very close to the opening price,meaning that the bulls were able to show resistance
IMPORTANT:Keep in mind that we can identify different trends:
- downtrend
- uptrend
- sideways trend
I hope that this was helpful and if you think so,make sure you drop a follow to see my upcoming posts about different chart patterns.Have a nice day and happy trading/ "HODLING" !

Congratulations @galuskaaa! You have completed some achievement on Steemit and have been rewarded with new badge(s) :
Click on any badge to view your own Board of Honor on SteemitBoard.
For more information about SteemitBoard, click here
If you no longer want to receive notifications, reply to this comment with the word
STOPGreat info! Voted and following