Why does Technical Analysis work in Financial Markets?
So many different definitions of Technical Analysis. Let me give you mine, so you can try to understand better why it works.
Technical Analysis is the study of buyers and sellers’ behaviour.
I know, it doesn’t sound like a proper definition. Let’s add “through cool lines and indicators” or, to keep it formal, “through the study of past market data”.
Technical Analysis is the study of buyers and sellers’ behaviour, through the study of past market data.
Joe sells strawberries. He produces 100kg per day and, after analyzing the market, he decides to set a start price of $5 per kg.
He finds convenient to sell at $5 per kg, because, adding all the costs, he spends only $2 per each kg of strawberries that he produces.
DAY 1
The first day doesn’t go very well. Joe sells only 20kg. He decides to wait for the second day and he keeps the same price.
DAY 2
The second day is the same. Joe only sells 20kg.
DAY 3
On the third day, he has 260kg of strawberries and he decides that it is time to lower the price. He is selling now at $4.50 per kg. More buyers start to come around and Joe sells 60kg that day.
He decides that it is not enough and he should do something otherwise he will be left with so many strawberries that are going to be wasted. He decreases the price, from $4.50 to $3.50.
DAY 4
The forth day is a super success. Buyers start to find very convenient a price of $3.50 and Joe finishes all the strawberries.
DAY 5
On the fifth day, Joe has the problem to think of a new price. He knows that many buyers will come around to buy at $3.50. The demand is high but his supply is limited now, he only has 100kg. He decides to come back to $4.50.
He sells 70kg and he decides that he can try again with $5.
DAY 6
The price of $5 is clearly too high. Joe only managed to sell 10kg.
DAY 7
Joe thinks to try a new price: $4. It is a success, he sells 100kg of strawberries, but he still has some from the previous day, so he decides to lower the price. The new price is $3.50.
DAY 8
Sold out! Joe goes home earlier because he sold all the strawberries in the morning.
DAY 9
Joe tries to figure out the best price for his 100kg of strawberries. He goes for a price of $4 again and he sells 80kg this time.
DAY 10
Joe continues with the same price of $4.
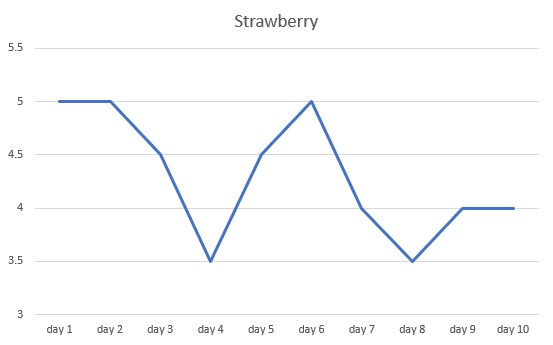
If you put on a daily chart these prices, you would have something similar to what you have on the stock market, the currency market, cryptocurrencies and any other financial market.
I actually created a daily chart with excel, even if we only have 10 days in this example.
With a chart like this, an analyst would easily say that there is a channel, where buyers find convenient to buy at $3.50, while sellers find convenient to sell at $5 (or buyers don’t find convenient anymore to buy at $5).
The example is not very accurate because there is no one like Joe that can control the price in the market and because we were not referring to a Financial market, but it shows very well how buyers and sellers act.
They try to buy and sell at prices that they find convenient.
Technical Analysis is just this. Trying to understand where supply and demand are usually concentrated and where buyers and sellers usually find convenient to enter the market.
Follow me: @forex-intraday
Legal Disclaimer: Any material or information in this article is general educational material and you will not hold anybody responsible for loss or damages that may result from the content provided here.
Trading has large potential rewards but also large potential risk. You must be aware of the risks and be willing to accept them in order to invest in any Financial market. This article is neither a solicitation nor an offer to buy/sell any financial instrument.
Trading carries a high level of risk, and may not be suitable for all investors. Before deciding to invest, you should carefully consider your investment objectives, level of experience, and risk appetite. The possibility exists that you could sustain a loss of some or all of your initial investment and therefore you should not invest money that you cannot afford to lose. You should be aware of all the risks associated with trading, and seek advice from an independent financial advisor if you have any doubts.
Past performance is not indicative of future results.
#bitcoin #ethereum #ripple #xrp #bitcoincash #eos #litecoin #stellar #lumen #cardano #ada #iota #tether #neo #tron #monero #dash #ethereumclassic #nem #binance #binancecoin #vechain #tezos #omisego #steemit #steem #money #life #cryptocurrency #cryptocurrencies #altcoin #altcoins #trading #invesment #investments #forex #forextrading #fx #fxtrading #fxmarket #market #finance #gold #silver #commodity #commodities #stock #stocktrading #stockmarket #facebook #fb #apple #aapl #bcd #bitcoindiamond #diamond #digibyte #dgb #spx #xau #xag #usdjpy #usd #amazon #amzn #google #googl #alphabet #xem

haha remind me on the chicken egg farmer story how i initial learn bought buyer and seller in marketplace. Good read
Ahahah thanks!
Brilliant outline; nice and simply explained!!
Thanks @hoppe :)