GBPJPY Ascending Triangle Pattern
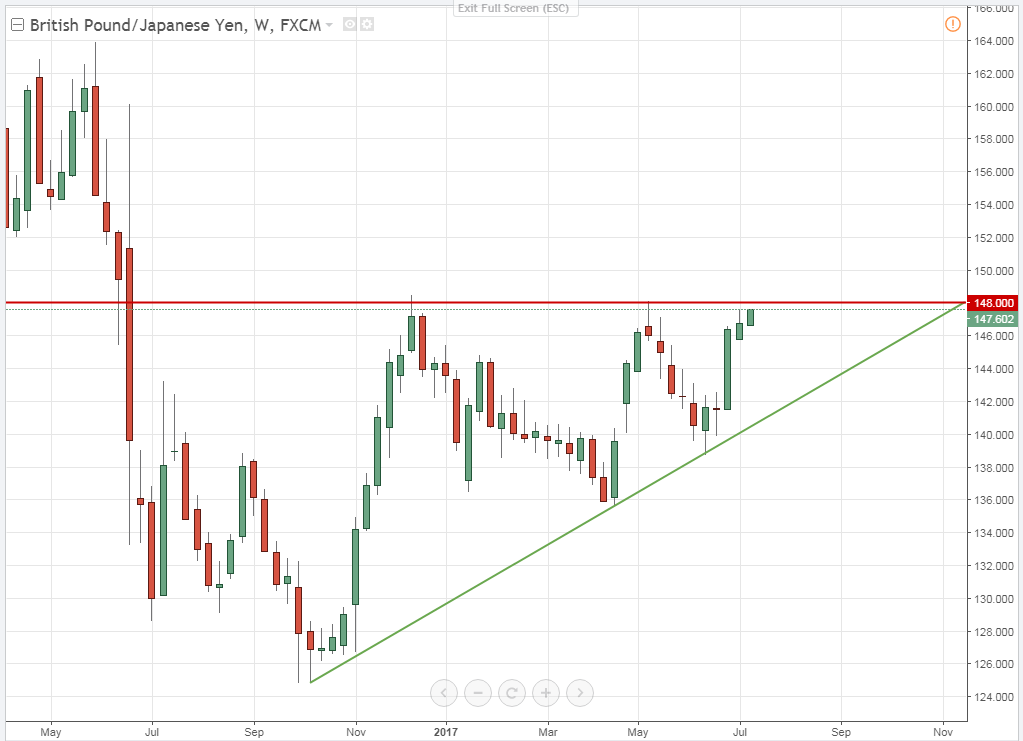
GBPJPY has got it self into a Ascending Triangle and the price is nearing the resistance line.
That particular resistance line has been tested two times since October 2016,and now it's going to be tested for the third time.
What happens if the price breaks through?

Price needs a lot of bull power to break that kind of resistance.
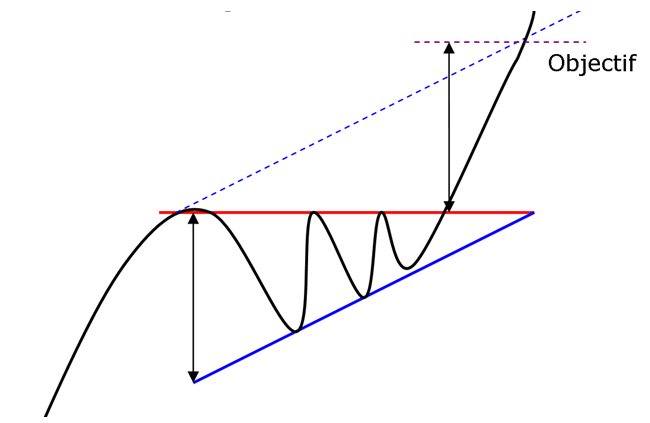
After a breakthrough of the resistance line (Ascending Triangle) price starts to move up really fast and the chances to turn back down are big.
Price is going to move back down and test that broken resistance level.If it does and if the price doesn't break the resistance level then the resistance level becomes a support level.
Potential checkpoint of the price after that scenario might be the price range between 165.000 and 170.000.
Wow. Nice post. Whats up @fisnikk I just followed and up voted. Hope you will stay with me & follow me
Thanks for your upvote @shahabuddin222.
Looking forward to follow you back my friend.