How to Find the Top Cryptocurrencies to Trade With the Coygo Screener
How to find the top cryptocurrencies to trade with the Coygo Screener
“What’s the best cryptocurrency to trade” is a very common question you’ll see come up on forums and chat groups. Every trader wants to know what the best coin or token is so they pick it up early and make a quick short-term profit trading.
The Coygo Screener is a tool that allows digital asset traders to build powerful custom filters to search coins by price, market cap, short-term SMAs (simple moving averages), and a number of other helpful data points. In this post I’ll be going over how you can use this tool to assist in finding the best cryptocurrencies to trade, with a focus on short-term (one week or less) swing trading and price movements.
(Please note that as of writing Coygo is in a beta period and these screens might change).
Real world example: Find coins trending towards a bullish reversal for swing trading
Before we dive into how the Coygo Screener works and how to use it, let’s first demonstrate how it can be helpful with a real example. Let’s look for coins that are currently trending towards a bullish reversal from their 5 day trend, and we’ll filter out coins with a low 24h volume and market cap to ensure we’re only looking at coins that will have enough liquidity and activity to allow us to get our trades filled.
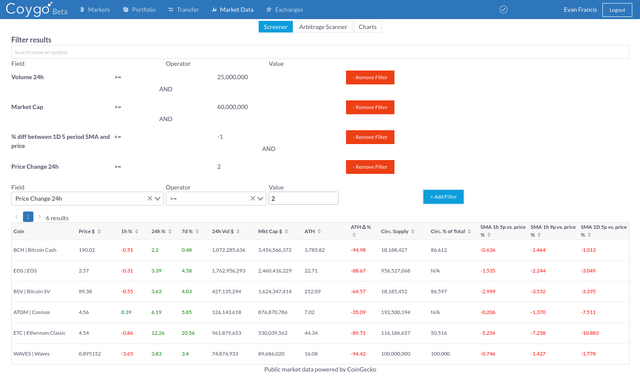 Coygo Screener example finding possible bullish reversals
Filter out low volume coins
First we’ll add a filter to only show coins with a 24h volume ≥ $25,000,000. Using the table I can see that the top 50 coins by market cap have a 24h volume mostly above $25,000,000 so that seems like a decent number while still allowing some smaller coins to be included.
Filter out low market cap coins
Along the same lines as above, let’s filter out coins below a market cap of $60,000,000. Using the table I can see that the top 60 coins are above $60,000,000 market cap, so again that seems like a good amount to still allow some smaller coins.
Filter to only include coins below their 5 day average (SMA)
Now let’s find coins that might be trending towards a bullish reversal. We can do this by combining a couple filters that use SMAs (simple moving averages) and recent price changes. (If you want to learn more about SMA you can read this great guide by Investopedia.)
First we can look for coins whose price is below the 1D 5p (1 day, 5 period) SMA by at least 1%. This means that the coin’s price is below its 5 day SMA, which can tell us that it’s been in a bearish trend.
Filter to only include coins with 24h price change >2%
Finally, we can filter that resulting set of coins to find those which have a 24h price of >2%, meaning that they’re still below their 5 day average but in the last 24h/1D the price has increased by at least 2%,. This can be an indicator that it might be about to reverse its bearish trend towards a bullish one.
Using the results
The resulting list of coins seen in the screenshot includes 6 different results: BCH, EOS, BSV, ATOM, ETC, and WAVES. These all appear to be in a somewhat attractive state for day trading or swing trading as they have enough liquidity to get our orders filled and they appear to be trending towards a bullish reversal. With that info in mind, we can use this list as a starting point to find which coins we want to trade for the day/week. We can then continue to analyze their respective markets’ order books, trade history, and candlesticks to determine if/when we want to enter a position and place a trade.
Coygo Screener overview
First let’s go over the basics of how the Coygo Screener works. You can access the Screener below the candlestick charts while watching any market on the Markets screen, or you can view a larger full-screen version of the Screener on Coygo’s Market Data screen.
I have highlighted the Screener on the Markets screen in the screenshot below.
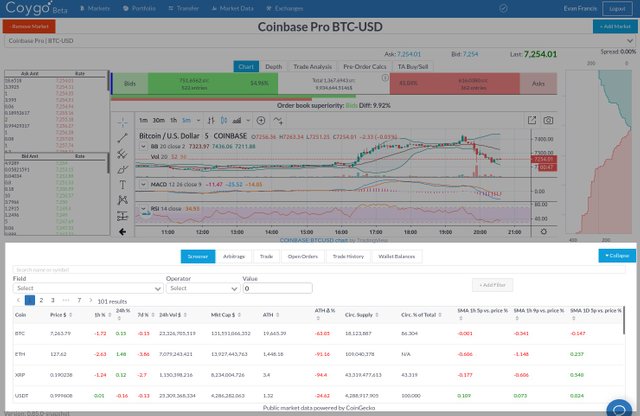 Coygo Screener
Text search
In the top we see a text search field, the input with the text “Search name or symbol”. This can be used to quickly search for coins by their symbol, such as “BTC”, or their name, such as “Bitcoin”
Custom filters
Below the text search we see where we can compose custom search filters. You can use the inputs to select a Field to filter on (such as price), an Operator to apply (such as ≥) and a Value to compare against (such as 500). Then to the right is the “+Add Filter” button which lets us add any filter we’ve built, and combine it with other filters.
Results table
The table contains all results that match the current text search query and custom search filters. You can click the up and down arrows in each table column header to sort by each column, by default they are sorted by Market Cap.
Available data points for searching & filtering
We have a number of different data points available to use when searching, and they can be combined in a number of interesting ways. First let’s go over each data point we can use, then we’ll go over how we can combine them with custom search filters to find the right coins to trade.
Coin — The name and/or symbol of the coin.
Price $ — The price in USD.
1h % — The price change in % in the last hour.
24h %— The price change in % in the last 24 hours.
7d %— The price change in % in the last 7 days.
24h Vol $— The total traded volume in USD across all exchanges in the last 24 hours.
Mkt. Cap $ — Total market cap in USD.
ATH — The all-time high price in USD.
ATH Δ %— The change in % since all-time high price.
Circ. Supply — Total number of coins/tokens currently in circulating supply.
Circ. % of Total — Percent of total circulating coins/tokens currently in circulating supply relative to the total supply that will ever exist (note: some coins don’t have a finite total supply).
SMA 1h 5p vs. price % — The difference in % between the 1 hour 5 period SMA and the current price. If this number is negative, the current price is below the SMA, if it’s positive the price is above the SMA.
SMA 1h 9p vs. price % — The difference in % between the 1 hour 9 period SMA and the current price. If this number is negative, the current price is below the SMA, if it’s positive the price is above the SMA.
SMA 1D 5p vs. price % — The difference in % between the 1 day 5 period SMA and the current price. If this number is negative, the current price is below the SMA, if it’s positive the price is above the SMA.
Good luck trading!
I hope this guide has been helpful to you, if used correctly the Coygo Screener can be a very powerful tool in a cryptocurrency trader’s toolbelt. If you’re interested in using Coygo you can try it for free by signing up at coygo.app. You can follow us with the links below to keep up to date:
Facebook: https://www.facebook.com/CoygoHQ/
LinkedIn: https://www.linkedin.com/company/coygo
Twitter: https://twitter.com/CoygoHQ