3 Tools To Master Crypto Day Trading And Always Stay Ahead Of The Competition
Day trading cryptocurrencies can be a tricky beast. Crypto markets never close so there isn’t really a definitive end of the day, but the idea is the same as day trading other asset classes like stocks. You trade throughout the day and close any positions before going to sleep or calling it quits.
With day trading the key to staying ahead of the competition is having access to the right data and being able to quickly gain insights from that data. In this article I will be going over 3 tools that you can leverage to stay informed and make the right decisions while day trading cryptocurrencies and other digital assets. There are many resources online for how to use candlestick charts and indicators such as MACD, RSI and Bollinger Bands in your trading strategy so I will be focusing on more unique tools that can give you an edge over other traders.
Order Book Superiority
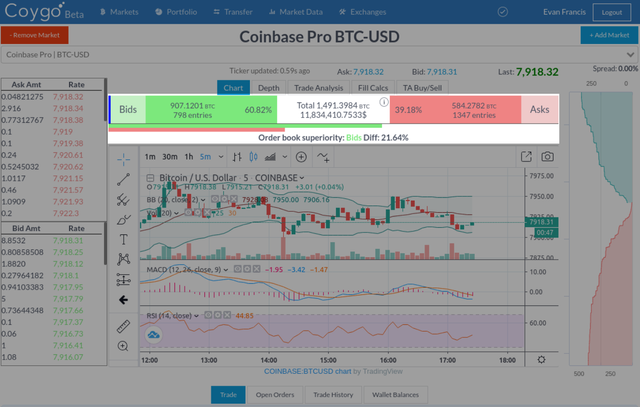
Order Book Superiority is something that isn’t common in the world of crypto, but it can be a powerful tool to quickly assess which direction other traders and trading bots think the market may be moving by analyzing the current state of the order book. Coygo, a multi-exchange crypto trading app, provides a great view of Order Book Superiority so I will be using that in the examples below.
 Order Book Superiority in Coygo
Order Book Superiority in Coygo takes all open bids (buy orders) and asks (sell orders) within 5% of the last traded price, and calculates both the sum of orders as well as the total number of orders. Sum gives us how much overall value is waiting to be bought or sold in open orders, and count lets us know how many buy and sell orders there are. Green is used for all bid (buy) numbers, and red is used for all ask (sell) numbers. The bar graph below let’s us quickly visualize the difference between total sum of bids vs asks, with the percentage difference below it. In the screenshot above, we see “Order book superiority: Bids Diff: 21.64%”. This tells us that there is more money in open buy orders than open sell orders within 5% of the last price.
Actionable insights
When there is a big difference between bid vs ask sum, this can mean that there is more interest by other traders in either buying or selling. If significantly more money is tied up in sell orders than buy orders, that may show that people are predicting the price is moving downwards .
When there is a big difference between bid vs ask count, this means that more individual traders are trying to buy or sell. If there is a higher bid sum, but a much higher count of ask orders, that may mean that there is only one or two large bid orders that are skewing the superiority, which can easily be cancelled to change the superiority. This is one way that other traders or bots can manipulate order books to make it appear like there is more interest in buying or selling than there actually is.
Trade Analysis
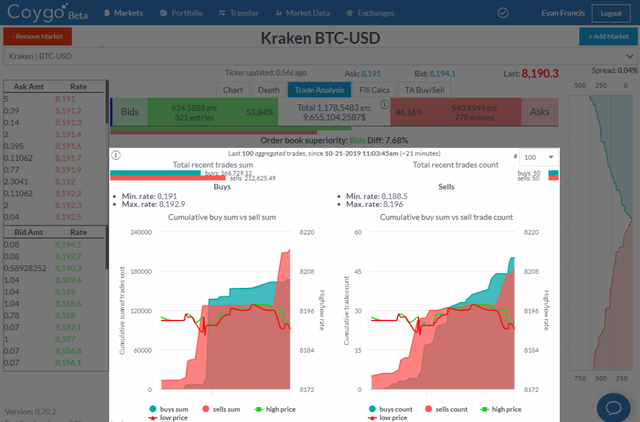
Now let’s look at another tool provided by Coygo: Trade Analysis. If order book superiority is looking at the future with open orders, Trade Analysis looks at the past with recent public trade activity. View trades as they occur in real-time and analyze recent trade activity on any exchange or market that Coygo supports. Compare recent buy vs. sell order count, and buy vs. sell cumulative sums on any market.
 Trade Analysis in Coygo
On the left we see an area chart of the cumulative buy vs sell sum over time, with the high and low price for each interval overlaid with green and red lines. Above we see a bar chart comparing the total buy and sell sum. On the right we have a similar display, but this is for the cumulative buy vs sell count.
Actionable insights
One great use of this is to spot if a large increase or buy or sell volume is organic from a number of traders, or from a large order by a whale. If the cumulative sum of buys drastically increases over a short period of time, and the count of buy orders during that time period stays relatively the same, that tells us that one or a few large buy orders were made
If there is a higher cumulative buy sum than cumulative sell sum (on the left chart) and they begin to converge, this can mean that sentiment is changing as more value was previously being bought but now more value is being sold. Combined with other indicators, this can be a powerful tool to quickly assess where the momentum is moving.
Arbitrage Scanner
Arbitrage trading is a common strategy for day traders, regardless of which asset class they’re trading. If done right it can guarantee a quick profit, but tracking down the profitable spreads and acting on them quickly is key to success.
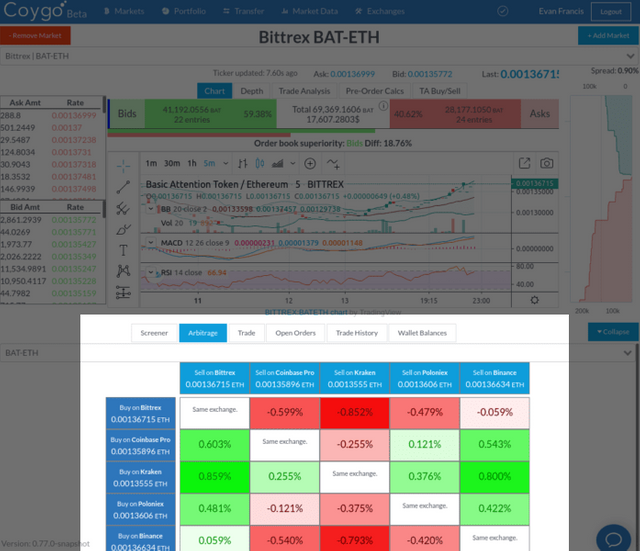
Finding spreads (differences in prices) across exchanges requires monitoring a number of exchanges simultaneously and doing the math to determine which is the biggest spread. Doing this manually can be a tedious and slow task, in reality this isn’t feasible. For that reason it’s always best to use a tool that can help quickly find and assess arbitrage spreads as they can change very quickly. Again Coygo provides a great solution for quick arbitrage scanning, so I will use that for my example.
 Arbitrage Scanner in Coygo
As seen above, when watching a market on Coygo you can use the real-time Arbitrage Scanner to monitor prices and spreads in real-time of that same trade pair on other exchanges. The largest spreads are highlighted with darker colors. Profiting from arbitrage requires quick thinking and action, with Coygo you can find arbitrage spreads, submit trades to multiple exchanges, and transfer between exchanges all from the same interface.
Actionable insights
- When you find a large spread that means that you can profit off of it by buying on the exchange with the lower price and selling on the exchange with the higher price.
Good luck!
As you can see having access to real-time data and being able to quickly gain insights from data sources such as order books, trade history, and price tickers can give you a big advantage over other traders and help you make the most informed decisions while developing your day trading strategy. Everyone has their own trading style and goals, but regardless of those goals data is always key to success.