BTCUSD chart, minor level: Elliot Wave structure update
All right folks!
Here is my update on the BTCUSD chart:

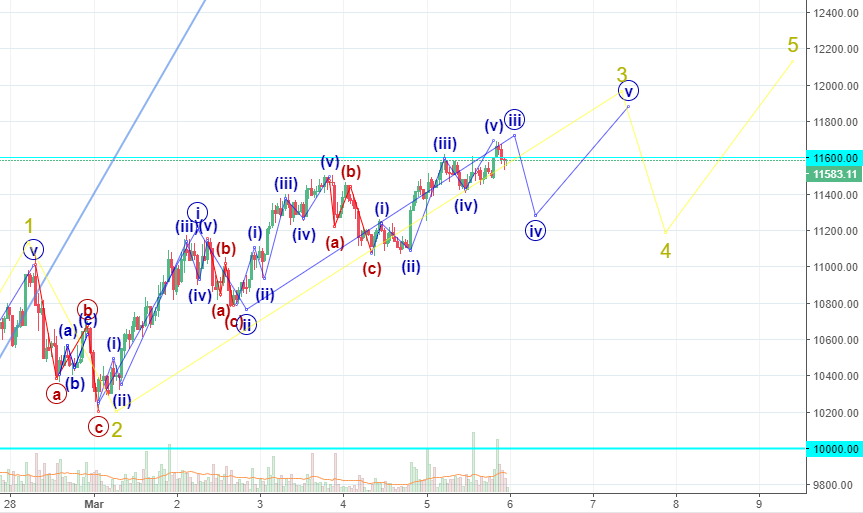
We are near the ending of the minor level impulse (yellow wave).
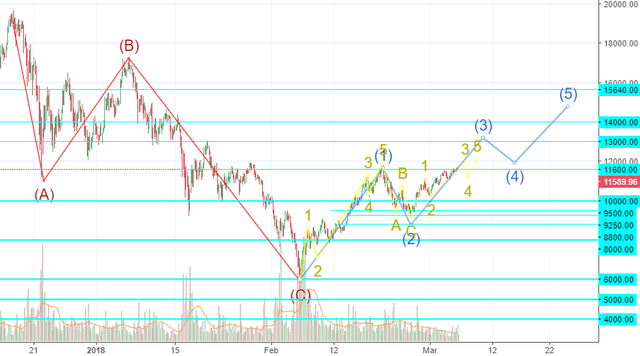
Here is the abstract vision of the pattern:

Wave (3) of the intermediate level can be the same length with the (1). There is not much space for wave (4) (it should not go below the top of (1)
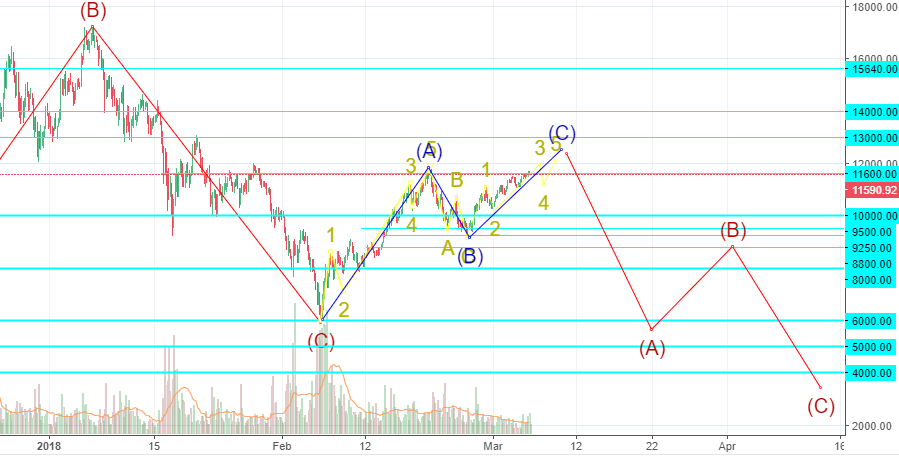
And the alternative pattern of the double ZigZag:

My idea as to place stop-loss orders near $11 000 - that is the top of the wave 1 of the minor level.
Wave (3) is weaker than (1). That is very important to keep in mind the Double ZigZag scenario now.
Stay tuned!
Given weak volumes we will probably test $11k soon... Volumes are interestingly weak but I think it is good as selling here makes less sense for holders.