DYOR and how to pick and trade successfully.
So whats that DYOR and how to really start with it?
Anyone would like to make consistent profits.
There a few ways of making profits(not consistent but still profits).
- buy bitcoin and HODL - HOLD till the price get higher from your entry point and sell it when comfortable enough with return.
- play trading game.
Many people will tell you that trading is hard. That's true for people who are not disciplined.
I will cover few things to show you how ease this process is and try to show how make some nice profit.
To be successful in trading there are 3 things which once combine will make killing profits.
- Do Your Own Research - (DYOR)
- Buy The F~#$ing Dip - (BTFD)
- Hold - (HODL)
Ok,let me explain one thing. Trading is not about winning all the time. It's about not loosing or minimising loss.
This is not some magic, can be done with practice.
At the moment we have over 1000 alt coins which most are not relevant and are simply pump and dump.
get this right. In trading game you not looking to stick to alt coin. You trying to make more bitcoin you have. This is main purpose of trading alt coins.
Why alt coins you will ask?
- high return - higher than bitcoin in shorter time frame
- more liquidity - easier to sell or buy
Ok, let's pick any coin. In this example i will pick up NEO for example.
Exchange i will be using is Binance
Have great liquidity and highest daily volume of NEO.
Tools we will be using is Binance chart with some indicators.
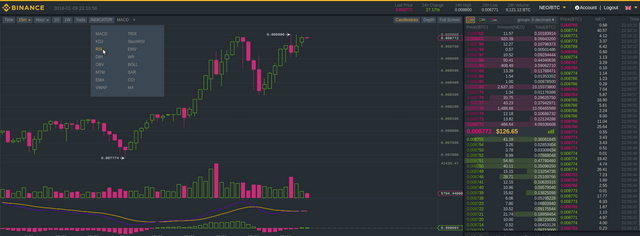
Go ahead and start Advance chart:
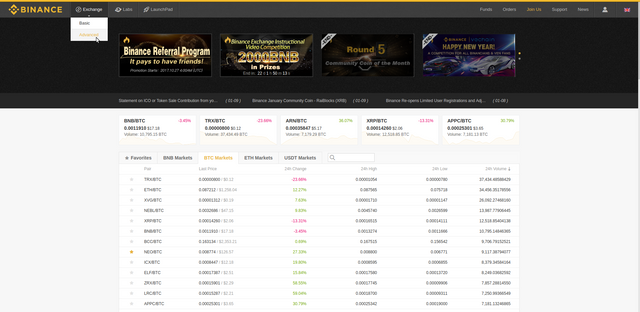
Now pick NEO:
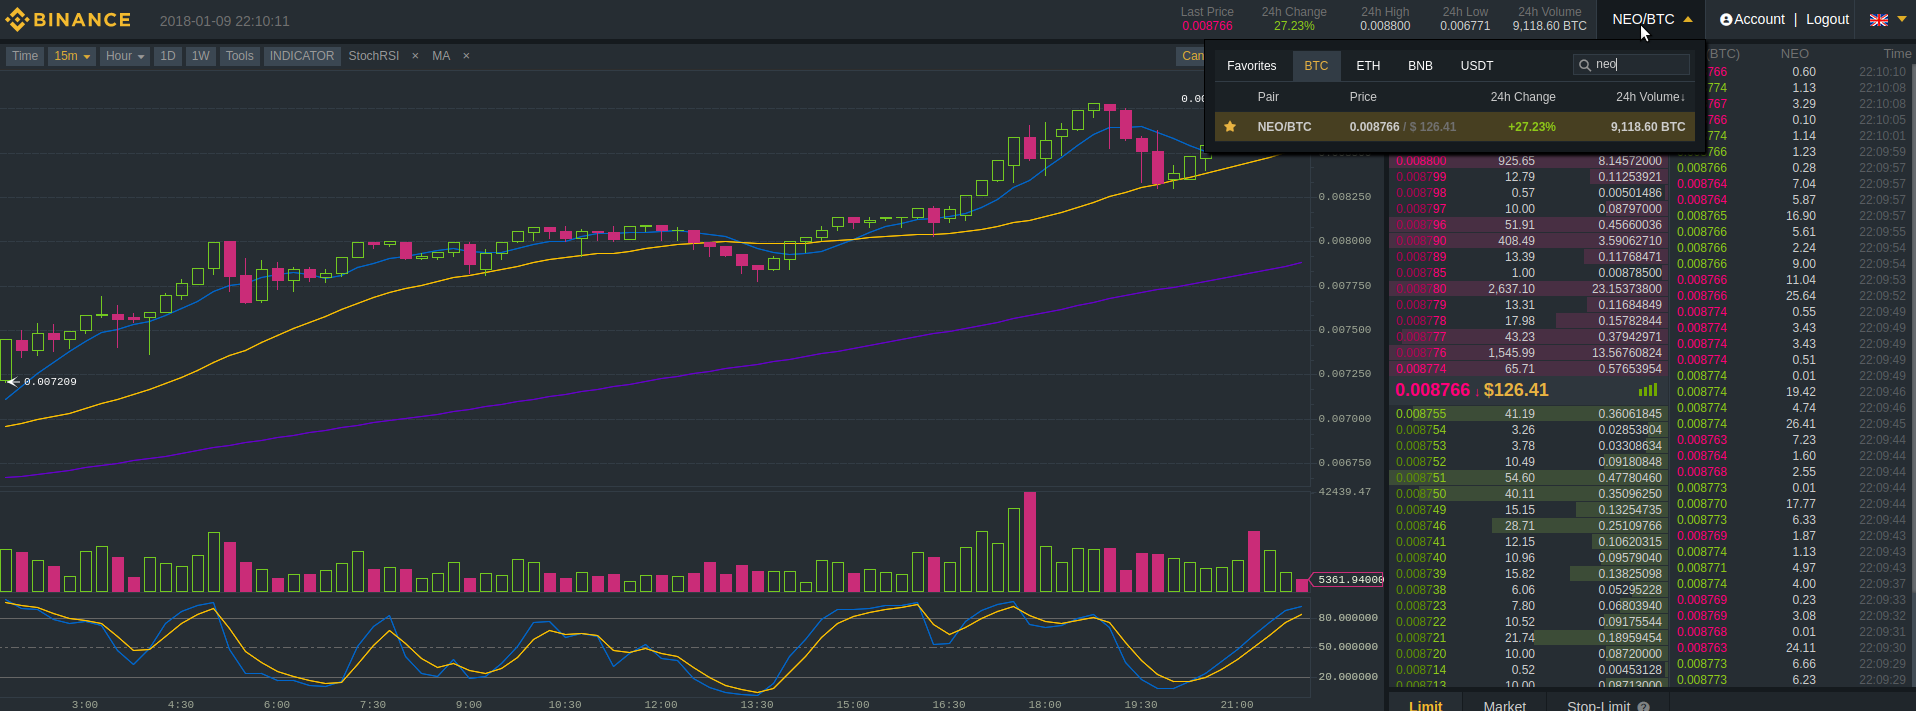
Now you can see chart.
Open indicators and check for MACD - Moving Average Convergence Divergence and click it:
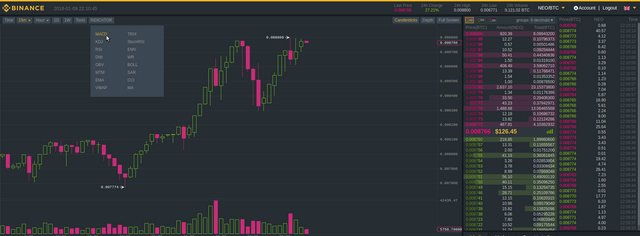
Once you done that below chart you will see indicator showing two lines(curves), yellow and purple and bars (red/green).
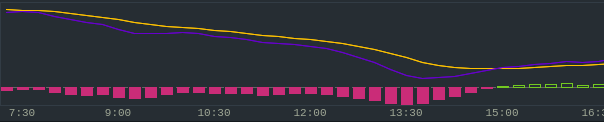
On this picture we can clearly see that lines are very low which will give a lot of spacet to go up. If lines are ready to cross that's even better. That means volume increased and price might go up.
This was first indicator. Now let's move to next one.
Again go to indicators and look for RSI:
RSI - Relative Strength Index
That's the blue line moving between 0-100 range.
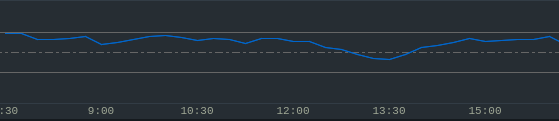
When line is on the level 70-100 it means that coin is overbought. So in other words price might go DOWN.
When line is at the bottom at level 0-30 it means that coin has been oversold. So now same coin might go UP
What you need to find is centre between Oversold RSI and Low MACD which is about to cross.
It's not that hard as you think. Ok, will give you an example:
On 13.12.17 Neo was 0.00217 and RSI was about to cross:
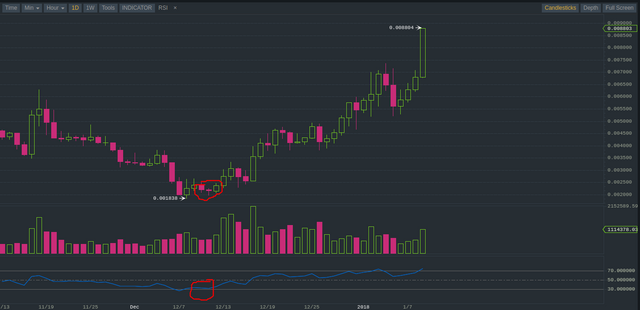
MACD was showing range 0-30 so coin was oversold. 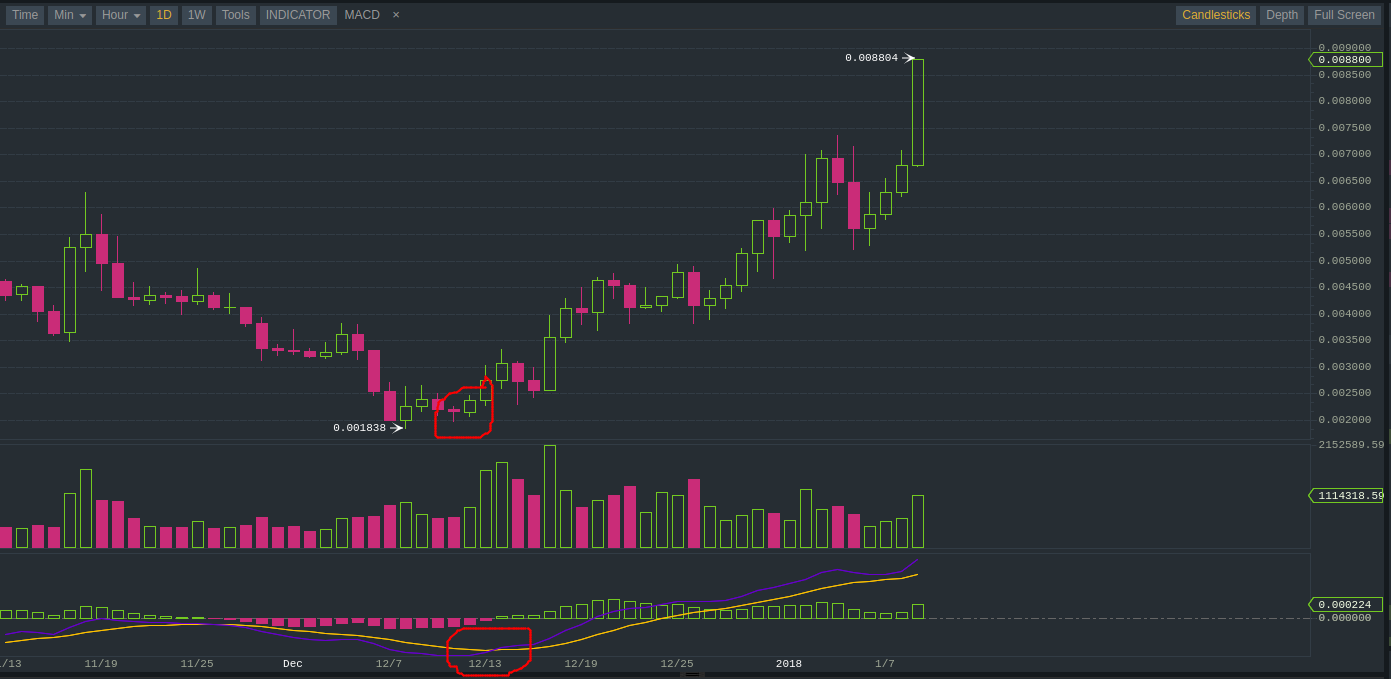
That means two indicators was posibly showing next move-UP
And within few days we had confirmed move up.
So as you can see trading is easy if you know how to use indicators to confirm next move.
Same thing opposite direction to give you heads up when to sell.
When RSI and MACD in higher range most likely price will go down.
Not always of course.
Don't always rely on this as sometimes direction can change even with indicators showing you different.
To limit your losses you can(read - should) start using stop loss option or stop limit option given to traders.
This will be my next article. Stay tuneed and if you have questions just ask.
Please follow me on twitter for more informative articles and for signals.