Gold Remains Stuck As It Struggles To Break Strong Resistance - Is A Pullback Immenient?
Despite Multiple Attempts Gold's Running Out Of Puff
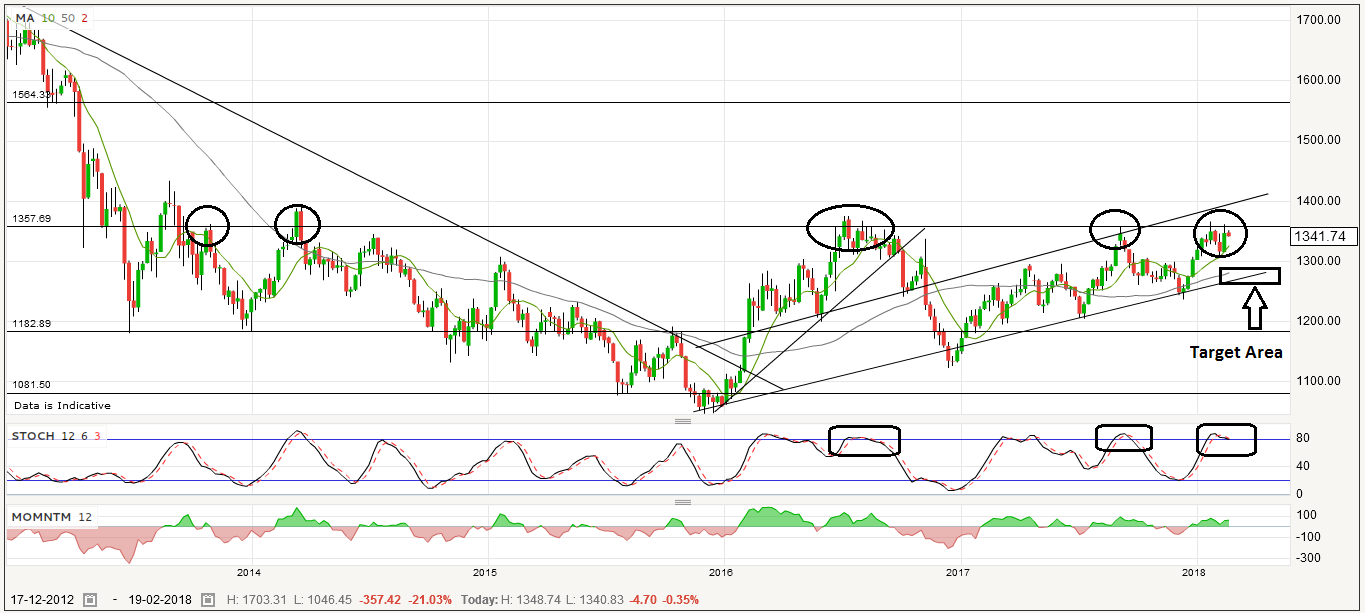
Gold has been in an uptrend since reaching multi year lows in late 2016. After reaching $1,050 an ounce back in December 2016, Gold has been steadily climbing since then reaching a high of around $1,350 - $1,360 level on 3 different occasions. (See circles on price chart below)
Just recently it completed its 3rd attempt on the weekly chart and it appears based on the technicals of the chart that its preparing for an impending reversal from the recent highs on both the weekly and daily chart.
The Stochastic momentum indicator has recently performed a bearish cross as highlighted on the chart, which has shown to be a high probability of prices moving lower if only for a few months.
Contradicting the Stochastic indicator is the Momentum indicator which is both in the green and rising which suggests that there is divergence within the 2 indicators and further confirmation is required.
We would likely need to see 1 to 2 more weeks of lower prices in order to confirm if the reversal is in fact occurring and setting up for a medium term lower prices to the target area. (Shown on the price chart with the rectangle box)
This rectangle box target area would need to be respected for Gold to remain within its bullish uptrend phase, otherwise the 14 month run of higher prices would be over.
Weekly Chart
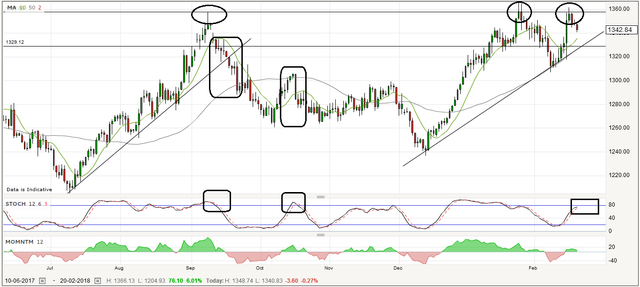
Triple Top Signalling A Potential Short Term Reversal
Although the price action on the daily chart suggests its too early to confirm of a reversal is formed, the setup with the triple top resistance indicates that the market has trouble pushing prices higher once it reaches the $1,360 price level and the sellers overwhelm the price.
Both the Stochastic and Momentum indicator are still bullish as they have not signaled a reversal yet, the momentum indicator is falling from recent high levels while still remaining green.
After falling for a few trading days we may see a pause in the selling as the market may move it slightly higher before returning to further selling and lower prices. By Friday this week we should either have confirmation of a reversal on the daily chart or be very close to seeing it.
Similar to the weekly chart the daily Stochastic bearish cross is quite reliable in providing notice of a loss of momentum and a move lower is about to come as shown with the previous areas highlighted on the chart.
Lastly the next support level of $1,330 level needs to hold if the price of Gold does fall in order to respect the daily uptrend of Gold. If the price confirms a close below $1,325 we could see $1,300 as the next target on the way down to lower prices.
Daily Chart
Happy trading and stay CALM.
Thanks for viewing this post

Disclaimer: This post is for educational purposes only, and all the information contained within this post is not to be considered as advice or a recommendation of any kind. If you require advice or assistance please seek a licensed professional who can provide these services.
Sources:
Click the links below to view my latest Steemit posts:
The New Normal - US Stocks Rally Higher Despite Stagflation Arriving In The US
Did You Take Advantage Of The Mini Rally In Crypto's?
Bitcoins Capitulation Confirmed - Bounces Off Support As Cryptos & Stocks Rally Higher
The Markets Are In A Panic - Are We Close To A Capitulation In Stocks & Bitcoin?
Sydney Real Estate Investors Are In For A Rude Shock As The Market Finally Cools Down
Congratulations @crushthemarket! You received a personal award!
Click here to view your Board
Do not miss the last post from @steemitboard:
Congratulations @crushthemarket! You received a personal award!
You can view your badges on your Steem Board and compare to others on the Steem Ranking
Vote for @Steemitboard as a witness to get one more award and increased upvotes!