$DGB DigiByte Technical analysis
Now first of all, I wanna say that I'm not here to give trading advices, what I am doing is a Technical Analysis of the charts,marking support and resistance level, pointing out what I THINK the price is gonna hit if the scenario is bullish/bearish. I am in no way responsible for the profits, nor for losses you make on the market if you decide to trade based upon my charting.
ok now that I got that outa the way, lets start :Đ
I'll do a chart "legend" before every chart, in order to explain people what i was marking so they don't get lost.
Dark red= lowest support level, last line of resistance before breaking into possible new all time low's
Light red= lowest possible support prediction in current cycle
Purple = valid support levels of a cycle
Light green= previous high's, targets for building new support levels
Light blue= previous low's targets for making new local high's
So let's start, below is the DGB/BTC chart of poloniex on an daily timeframe (meaning 1 candle =1 day)
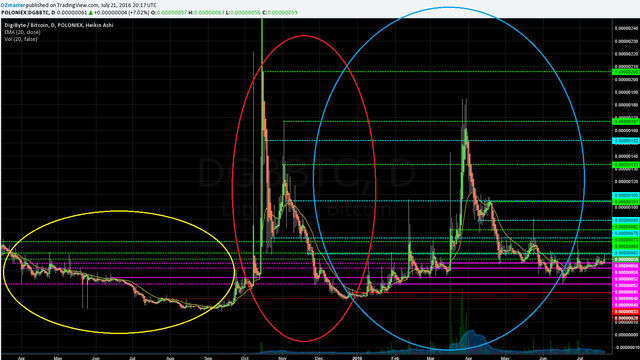
First about the 3 circles i did there, I consider them "cycles" of trading, what i mean by that is end of a down/up trend (depending on what u wanna be looking at) and the begging of the opposite, making of a significant price increase/decrease, returning towards the starting point. As you can see in the first cycle (yellow circle-call it "pre"cycle) before any real pump happened to DGB it was pushed down in price.
After the price refusing to go lower, the first real uptrend cycle(red circle) started resulting in a new all time high (from 18 satoshi to well over 200 satoshi per DGB). As new high was reached the price slowly began the downtrend of the cycle, finishing at 28 satoshi, bottoming at the "lowest high" from the previous cycle (look dark red line).
As the new support was discovered the 3rd cycle began (blue circle), reaching into the "highest low" of the red cycle, just to start turning down again to reach into one of the "lower high's" of the previous cycle.
The price has not touched the "lowest high" of the previous cycle, therefor it is yet hard to tell if the downtrend of the blue cycle is finished.
Lets get to the support/resistance levels for bearish and bullish scenraio's.
In case of a continuation of the downtrend, there are a few lines which could act as support points, those are marked with the purple lines (the broken out lines are to show where from the price respects the points, from all the way from the start up till today those particular points acted as support levels). The light red line should be the final support,meaning the price shouldn't drop below this price, if it breaks below there is a good chance there will be alot of selling and even more downtrend, but as long as the price bounces of the light red line it means it respected a previous high near to perfectly and is definitely ready for a new cycle of an uptrend.

The bullish aka uptrend scenario shows alot of possible future support( green lines aka previous high/resistance, to act as new low/support), and resistance (light blue lines aka previous low/support, to act as new high/resistance).
Bevare thou, as the diference in price's is essured with 1 satoshi on this coin, any previous high/low can act as a new support/resistance!
Not much to say about it, at the very moment it does look like the uptrend started but it cannot be 100% confirmed yet cos of the reasons i mentioned above, furthermore if the price keeps on going up, there is no way to pinpoint with 100% certainty from which resistance the price is gonna bounce back down, nor will it take a certain price level out and make new all time high.
Please share you're thought's AND experiences, comment my chart's, charting skills, I like good critics on this!
Are there any else "charters" within steemit?:)
Also let me know if the chart helped you in any way!
If anyone requires some further explanation or has any questions feel free to ask, will do my best to respond quickly and clearly!
Very nice analysis. I am long on DGB. Matter of fact, looks like a good time for entry.
Thank you, I myself did sort for a bag of DGB, I like the coins aim towards gaming alot, the reason which got me interested
Another great write up oz and explained perfectly as always :)
I've been holding DGB for awhile and am certain it will reach the moons of neptune. Also, I have heard the same rumor moonjelly mentioned, multiple times, including from the DGB BTC forum, so im thinking this may soon become a reality and no longer a rumor :D
I heard a rumour that MS Azure is adding Digibyte and the announcement will be made public soon. I know the Azure card it's played out but it instantly gives a boost and prestige to any project.
Didn't hear anything about that, but then again i didnt folow them for some time now, that would be great news just in time for some upwards movement
Thank you! Buy a litle!
DGB is a solid hold in my book, great analysis
This gold back token has really intrigued me but I've not jumped in yet. I'm definitely thinking about it.
Check my analysis on ETH-USD, ETH-XBT and DASH-BTC https://steemit.com/cryptocurrencies/@jholmes91/dash-btc-looking-at-0-018 https://steemit.com/cryptocurrencies/@jholmes91/eth-xbt-to-extend-to-0-023 https://steemit.com/ethereum/@jholmes91/eth-usd-long-term-reversal
This is why I love trading a different angle from each person, I will check my technique and see if it agrees :) I do like your charts it seems as if you are filtering fractal supports and resistances which is a part of my method. Interesting insight thanks!
This amazing investment opportunity for the average middle class worker. blockchain tech is the future, sadly to say many gamers has have payment payout problems but this was addressed a few months back and now may be fixed!