[Trading Strategy] Exponential Moving Average Cross
Starting the series of analysis of trading strategies, let's start with the simplest one: Crossing Moving Average
WARNING: The content of this publication is educational. If you wish to use the techniques described below make sure you understand all the risks related to operations in the financial market.
Strategy description
The trade strategy using the crossing of moving averages is one of the simplest ones that exist, where a fast moving average and a slow moving average are drawn on the price chart.
When the fast moving average crosses the slow moving average from the bottom up, it is a sign for purchase.
When the fast moving average crosses the slow moving average legend from top to bottom, it is a sign for sale.
In general, it is recommended by analysts that these signals of buy and sell provided by the crossing of the averages are used by following the trend of the price of the asset: If the general trend is up, the signal of purchase is used. If the overall trend is down, the sales signal is used.
This particular strategy will use exponential moving averages because this type of moving average has a faster reaction to the more recent price change.
It is also recommended that this strategy be used over time periods longer than 4 hours.
Used Indicators
EMA (12) - Exponential Moving Average of 12 periods, called fast average
EMA (24) - Exponential Moving Averageof 24 periods, called slow average
EMA (200) - Exponential Moving Average of 200 periods, as a trend indicator
Recommended Graph Period
4 hours
Operation Entry
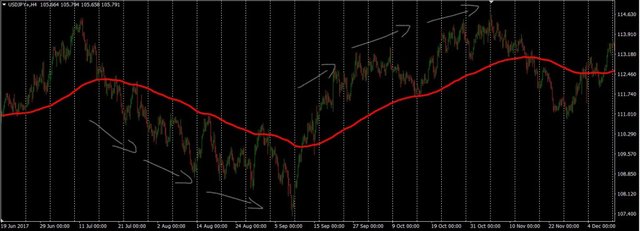
Initially it should define the current trend of the graph, and for this the EMA (200) is used.
If the asset price is being traded above the EMA (200), it is indicative of a bullish trend.
If the asset price is being traded below the EMA (200), it is indicative of bearish trend.
This can be seen in the figure below:

The use of the crossing of moving averages in markets with lateral tendency generally do not have good results.
After the definition of the trend, the crossing of the fast and slow averages are verified, as previously described, and the point of entry in the operation is chosen:
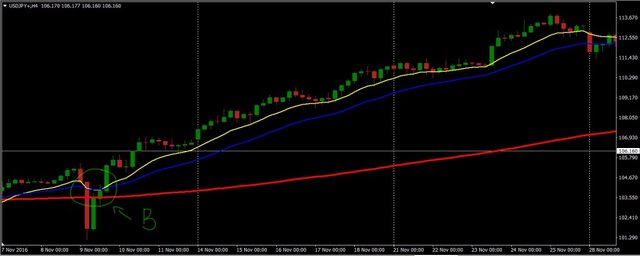
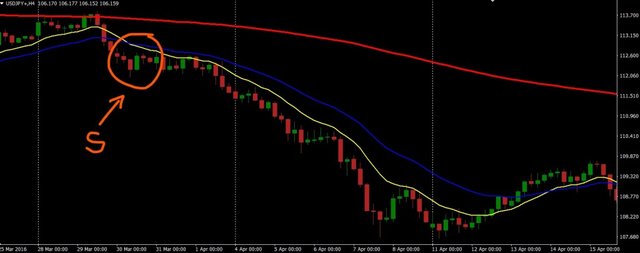
In bullish markets
- Enter the buy operation (long) when the fast average (EMA 12) crosses the slow average (EMA 24) from the bottom up
- Enter the sell operation (short) when the fast average (EMA 12) crosses the slow average (EMA 24) from top to bottom
This can be seen below:


Alternative Entry
With a little more risk, you can also consider entering the operation when the slow average (EMA 24) crosses the trend indicator (EMA 200) in one direction or another. This crossover may be a sign of a reversal of the price trend on a larger scale.
Operation Exit
There are two suggested ways to close the transaction using moving averages:
1 - Price reaching the fast average (EMA 12)
The exit point of the operation during a retraction to the fast average (EMA 12) is generally the exit point with the lowest risk, because in this movement, the price may either resume the previous direction or move in the opposite direction .

2 - Inverse crossing of moving averages
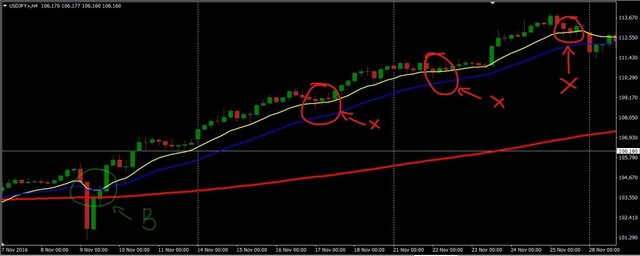
Another possible exit point of the operation is in crossing the averages in the reverse direction:
- In a buy operation (Long), when the fast average (EMA 12) crosses the slow average (EMA 24) from top to bottom
- In a sell operation (Short), when the fast average (EMA 12) crosses the slow average (EMA 24) from the bottom up

This exit presents a greater risk, since, as can be seen in the above drawing, because the moving averages are lagged indicators, the price change can be very large until the averages cross again.
Personal Strategy Considerations
Moving averages are good indicators of price trends, but have a slow reaction to price change and because of this, this strategy have a greater possibility of presenting signs of entry and exit in markets with a well defined trend.
Markets that are in lateral movement do not present good results with this technique, since the change of direction of the averages and their crossing happens too frequently.
Another problem is that the exit signals of the operation may appear too soon (exit by the touch of the price in the fast average) or too late (exit by the opposite crossing of the averages).
Therefore, it is important to consider a Stop Loss and Take Profit strategy, based on the history of the asset being traded. Leaving to exit the operation only when one of the exit signals appears can lead to large losses or small gains.
Also consider that, at times, averages can cross by only one candle, which will generate a false entry signal. Therefore, it is suggested that the use of crossing of averages be accompanied by some other indicator that helps to filter false entry signals.
Wanna try your luck in winning some SBDs? Check my 400 followers celebration post
Krypt(/)n1a username: @riyuwe
Good strategy for long term moves. Obviously works well in trending markets so you need to be prepared to get hammered when ranging (which is around 70-80% of the time).
The longer the time frame, the better this system works. If you're using it on small timeframes, you need to set your initial stop way outside the noise, preferably some multiple of ATR (at least 2 or 3) or based on some price action level (like a recent support or resistance level).
I think some people use the 200 EMA as a trailing stop, seems a bit extreme to me but I've never tested it so can't say. They say the 9 MA is like a sheet of paper, the 50 MA is like a wooden door, and the 200 MA is like the Great Wall of China. So if it breaks the 200 MA it's a major reversal.
If I used this, I think I would use the crossing back of the two smaller MA's to take profit and get out. If they cross back again then buy back in, there's no shame in taking the trade twice in the same direction, and getting two profits :-)
Like any system though I'd keep an eye on significant levels. No point risking a trade if your just about to touch a major support level or something. As long as you have a good money management / stop technique that can limit your ranging losses then it's an ok system. I think some long term investment funds use something similar, but it's over very long times.
That is actually the complement strategy i am using. When the price go down below ema 12, then turn back above It i use as another entry point.
As the SL, i use the ema 24 as base, plus some space added (wich is defined by backtrack test, wich i also do with the TP)
This strategy is the one i used as a First try as writting a bot, and even though the back had good profits, the drawdown is too big (i Will post some backtests also). I Will run some more tests this week with the SL fixed at the ema 24, and shorter TP.
Because so far, this strategy for the bot has been... Underwhelming. Because like you Said, crossing averages sucks on ranging markets.
I freak out as the price get Very close to TP, and then Go all way down.
The total profit Will probably be lower, but maybe i Will have a higher % of profitable trades?
I Will post a bit more about my bot experience, as soon as i have a bit extra time.
To be honest, I've tested a lot of moving average type systems as well and been totally underwhelmed. Something I did notice though, and you probably won't believe this - try reversing the signal direction :-)
Have a look at my post on backtesting, the 'profitable' chart I showed was actually a MA cross system in reverse. That is, when the Fast MA moved under the Slow MA it bought, and when it crossed back above it sold. Exactly the opposite of what the system is meant to do, but it made money...
https://steemit.com/trading/@tradergurl/the-benefit-of-backtesting
Will be interesting to hear about your bot experience, thanks.
Nice
Great
Kryptonia: @reonlouw
You got a 3.06% upvote from @ipromote courtesy of @phgnomo!
If you believe this post is spam or abuse, please report it to our Discord #abuse channel.
If you want to support our Curation Digest or our Spam & Abuse prevention efforts, please vote @themarkymark as witness.
great, From Kryptonia-reatimtim
Kryptonia name, ludevielucero
Nice post @phgnomo.
Have a nice day!
Nice post. Kryptonia id- @duquejunalyn