3 Amazing things we can now do with Satellites #2
In my current work at the European Space Agency, I work to help foster innovation around the use of satellite data. It is an exciting area that is currently seeing explosive growth. This both due to companies like SpaceX providing cheaper access to space, but more so due to advancements in computer science. The true potential of satellite imagery is only unlocked now thanks to Big Data analytics, cloud computing, and machine learning algorithms. Moving us from interpreting still-images, to using the continuous flow of image data as input to produce new services.
Here are some examples of exciting new applications that are both cool and disruptive:
Measuring the world’s Oil reserves
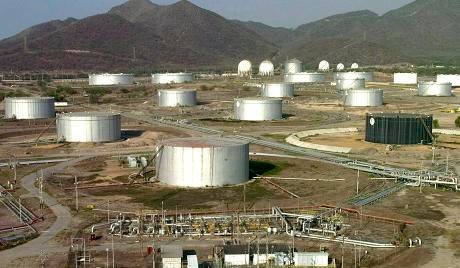
A significant amount of the world’s wealth is stored in oil reserves. More importantly, changes in the size of these reserves – the equivalent of changes in oil supply – heavily affect the price of oil. Having a good overview of the number of storage facilities, and their current size in close to real time, is therefore heavily in demand for many different reasons.
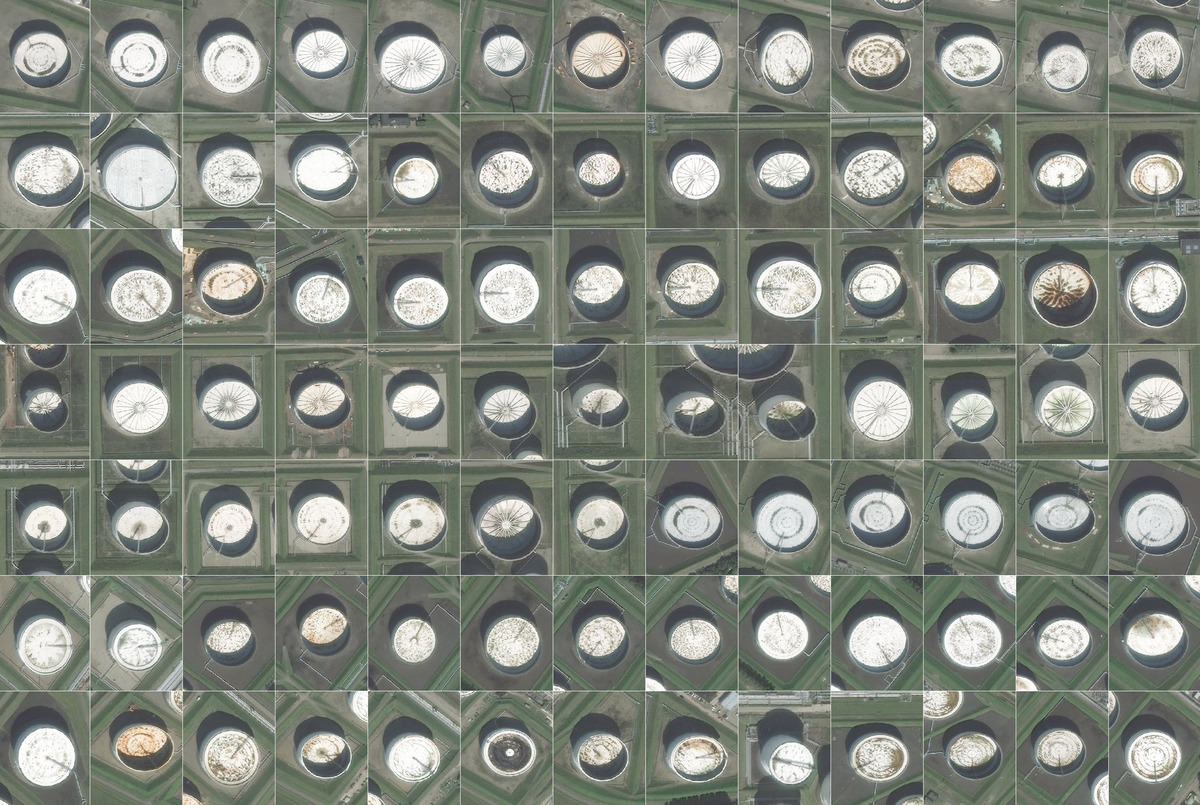
A compilation of satellite images of oil storage facilities around the world
source
Imaging satellites, even with medium scale resolution, provide fairly good images of oil storage facilities from space. More importantly, with the rapid increase in the number of satellites in orbit, the update frequency of images allow for a regular update of images. Computers are then fed this image data, which can provide some disruptive information services on one of the world’s most important assets. Once a machine learns what an oil storage facility looks like, it is piece of cake to autonomously detect these in images. First, the computer saves the location of all oil facilities in the world, and which country borders they fall within. Secondly, it can make a very precise estimate of the size of the facility by measuring its diameter directly before estimating its height based on the size of the shadow it casts on the ground. While the shadow on the outside gives a hint of the size of the tank, the shadow on the inside provides knowledge on how full it is. The larger the shadow, the emptier it is.
source
Thus, satellites can give very powerful information about the economic state of a country that is dependent on oil. Furthermore, as oil and gas prices are mainly dependent on the size of available reserves (the supply), this provides unique insight into the expected development in the price for crude oil short term. Indeed, the price of oil tends to fluctuate heavily whenever this information is revealed to the market. In mid-June this year, oil prices fell heavily when it was known that American oil reserves were larger than the market had thought source.
Holding information about this before the rest of the market could allow investors to make big gains by betting against the market’s expectations. As numerous industries and investors depend on this information, obtaining this through satellite images have disruptive power on both trade and business.
Detecting and monitoring dangers of avalanches
InSAR satellites, combined with interferometry processing of the data, allow us to detect changes in the height of the ground down to millimetre precision. The way satellites do this is by actively sending radar signals down towards specific points on the ground. These are then reflected back into space and received by the satellite, allowing the satellite to measure the time it takes for the signal to come back. This is then used to measure the distance to the ground. Because this is done repeatedly over the same points on Earth, we can tell if the distance has changed since the previous measurement was taken. The resulting data can have numerous applications, one of which is to see the changes in rock structures of mountains. Below you can see one such example from Lyngen in northern Norway.
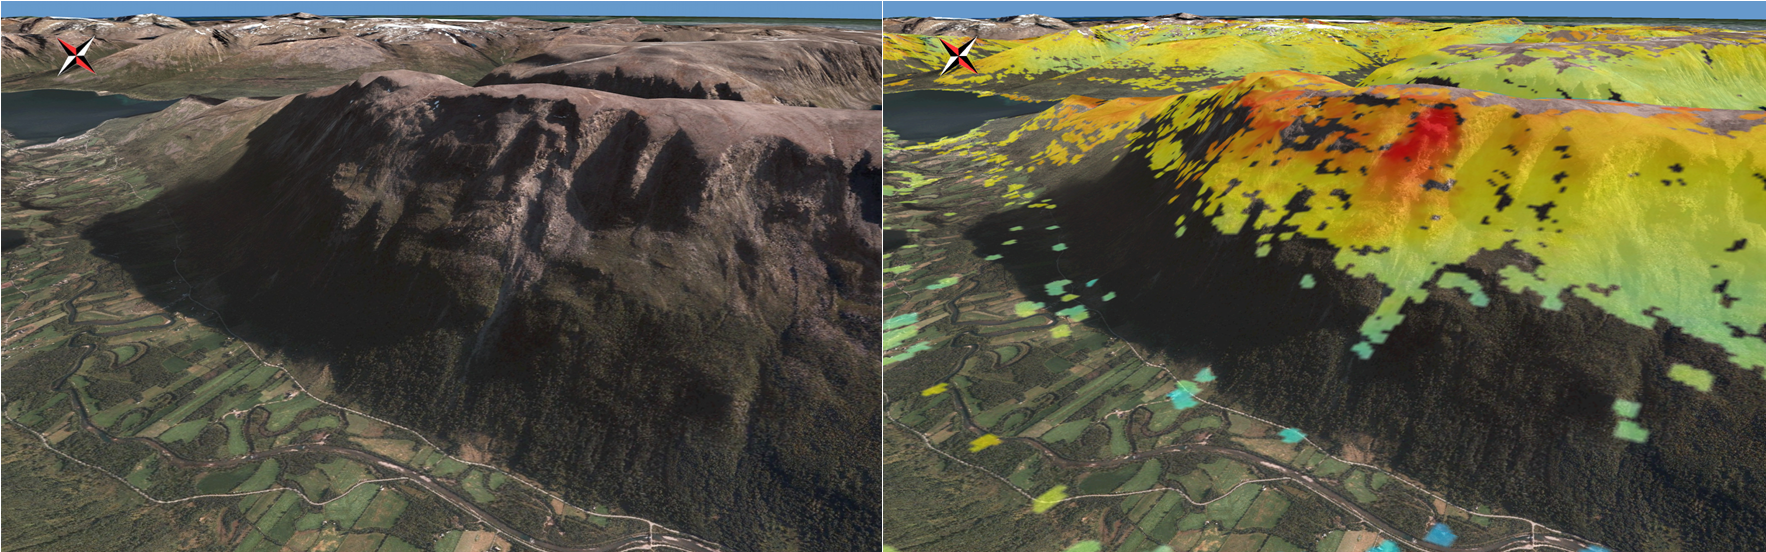
Adding a layer of InSAR processed data on top of this image of Lyngen, Norway reveals which parts of the mountainside are in motion.
As you can see, some parts of the mountains in the centre of the processed image show a stronger red colour than the rest. This indicates that the change in height has exceeded a specific number (typically more than a centimetre) over the past months. Combining this measuring capability with machine learning is where things really get interesting. Computers that are fed this data get increasingly good at recognising patterns that correlate with subsidence. Alerts can then be triggered when a given level of subsidence has been observed in a mountainous area, allowing us to know ahead of time if there is a risk of avalanches and rockfall. People can then be evacuated in time, or supportive structures can be built to prevent a landslide altogether, or at least protect local infrastructures and houses. Saving lives and costs.
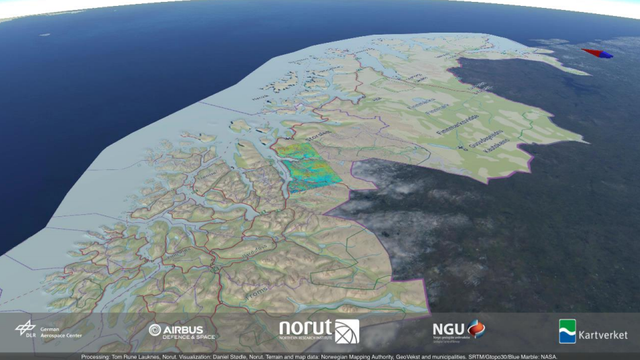
Avalanche monitoring in Troms, Norway source
Because satellites are global and revisit the same areas continuously, surveys such as these can be done autonomously for entire countries week-in week-out. The image above shows deformation mapping of parts of a region in northern Norway. This can potentially be done autonomously for entire countries, continents, or indeed the world. Work is currently in progress by the Norwegian Geological Survey to have a national level, frequently updated, deformation mapping service which new applications can be built upon by developers.
Detecting and monitoring algae blooms
Algae blooms is an interesting phenomenon to study for a few different reasons. This is particularly useful for inland waters, which are one of the most precious resources to many communities around the world. Because they provide drinking water, fish, a source of irrigation for crops, means for recreation, as well as playing an important role in the local ecosystems, their health is of vital importance. Due to the potentially very dangerous toxins that it produces, Algae blooms can sometimes threaten all the above. This makes it important to take steps to monitor, predict and handle its occurrences.

NASA’s Landsat 8 Satellite observes a large algae bloom in Lake Erie, Northern US and southern Canada source: NASA Earth Observatory_
I highly recommend having a look at the full-scale image to fully appreciate the detail and level of insight a satellite image like this can provide.
The image demonstrates the scale at which algae bloom can affect an area. As you can see from the image, there are numerous fields of agriculture surrounding the lake. These have most likely played a vital role in creating the algae bloom in the first place, as blooms are likely to occur when nutrition, often produced by agriculture, is made abundant in the lake.
Compilation of Proba-V - the Fourth Satellite in the European Space Agency’s Proba series (V stands for Vegetation) - images tracking evaporation in Lake Poopó, Bolivia source
Contrary from here on Earth, from space, clear inland-waters appear rather dark because there is very little content in them to reflect colour back into space. This makes it easier to detect, and understand, the chemistry of algae and other plants or acids that absorb more light.
Information produced by satellites, combined with computing power to help spot early symptoms and alert of algae growth, can help assist local communities, perhaps in rural areas, deal more intelligently with the potential occurrences of algae blooms. Whether it be by treating the waters before it occurs, to dealing with the consequences of its occurrence.
Want to try processing new satellite images yourself?
Today, huge amounts of data are made freely available through the Copernicus programme run by the European Commission and the European Space Agency. You can download the raw data from their satellite constellation yourself for free here, which can be processed professionally by the free and open source tool snap.
Did you find this information fascinating? Make sure to Follow me for more, and look also into my Beautiful Satellite Images of our Planet you won’t believe are real where part #3 will be online tomorrow!
Steem on!
Fredrik / @fredrikaa
I wonder what people two hundred years ago would think if they would be a day on earth now. Technology advanced so fast. The world in 200 years will be crazy.
I would expect farms to be run 100% autonomously based on data from both satellites and/or drones + ground sensors. Where autonomous drones fly out to spray where needed based on observations made by sensors, and where autonomous vehicles harvest grains and vegetables whenever they are at the peak of yield.
But we're just getting started really :) So much data for machines to start to learn from. And we're hardly using any of it! Yet ;)
Thanks for mentioning this, i had a similar idea, and it is really strange that this is not yet invented ...
But on the other-hand if it would be invented it could provide for free food....
and thats why it is not invented .... i guess (if we want we could have free basic food for everyone ! )
It should be a shared world goals to provide free food.
Also all machines are there and already invented, they just need to be combined together.
But instead of really solving food problems we rather send money (that vanish and get lost and get corrupted)
We already use machines for food production, the next (logic?!!!) step is they provide food in an automated way.
Can you imagine, instead of giving $ XXX.XXX.XXX to poor countries every year we could give them this (combined) machine and there biggest problem and first priority would be solved ...
But it seems we rather keep them in this unbearable position.
(...oil)
Things are going in the right way, although not always at the pace one could have hoped for. I see the democratization of these technologies, and the skills necessary to make good use of them, as the most critical factor for success. And I hope doing outreach around this can help accomplish just that :)
I am often awed at how technology can directly and indirectly be used in ways that would never have occurred to me.
They say innovation is dying, but this is evidence to the contrary. Great post!
Indeed. And this is only getting started!
It's the first time in human history that images on this scope and scale, with such frequency, are made freely available for the market. Where anyone with access to the internet, and developing skills, can build new services
I will keep on posting many, many more examples, for as long as I have them (there's a lot). But think I may do 1 by 1 going forward.
The oil storage facilities does looks like silver coins to me~
Algae bloom is so pretty under satellite!!
They do look like coins! :D
Haha, yeah indeed they do :P never thought about that!
Yeah the algae blooms look like auroras in the sky :o
Thanks for this amazing post (and the part #1) on applications of space data. I still find a lot of people that doesn't believe me when I tell them about the high interest of EO imagery. The access democratization to this information is a relatively new thing, but important agencies and bilateral organizations have been using this information (with human analysts) for a very long time, anyway, AI is going to disrupt this field.
We still need these outreach activities to reach the general public, so keep it at this level, please!
Thanks!
And yes, the steem community has a lot of amazing developer-talent in it. So hoping that some may pick up on it and perhaps make use of EO data in future applications.
Those applications for the data gathered by satellites are great and smart and I'm sure there will be many more to come in the future. I wish I could dig into the data myself, but I simply don't have the technical chops to :)
Glad you liked it! I took this course (link at bottom) to learn the basics of Optical remote sensing and how to access and process the data :)
To move from processed images to services would take you partnering with someone with some developing skills though, but learning to access to use images is not to difficult.
https://www.futurelearn.com/courses/optical-earth-observation
The course looks quite interesting, but if I devote time to learning some coding skills, I think I would actually start from something less complex and with wider practical application before I move on to more specialized and complex stuff. Which doesn't make this any less fascinating of course :)
I just started a project using hyperspectral imaging at work. It seems like the first applications of the technology were in satellite images. Have you made any posts on the subject? I need to browse through your blog.
That is really cool. Have you done a post about your project? Or is there a link to a project description? Would be an interesting read.
My posts so far have focused mostly on outreach on what satellites can do generally speaking, and the beautiful images they can provide. Hope to go more in-depth with future posts for those that are interested.
No, unfortunately I can't post anything about my work. The company is very conservative about the information is puts out.
Some of the first hyperspectral images I found were satellite photos of crop land. Each pixel had 256 different variables associated with different parts of the EM spectrum from UV to IR. That is compared to just 3 variables for a normal RGB color photo.
This video was an impressive example of what can be done now using off-the-shelf technology. They have another version of their hyperspectral camera that can be mounted on a drone to make maps.
But I would encourage you to write a post on your project as people may find it fascinating. I'm certainly going to follow you and would be happy to read it :)
If you would want to capture live satellite data at home, you could look into the cheap ($10) RTL-SDR usb radio module in combination with a Raspberry PI
Setup would look someting like this:
And you could receive images that looks similar to this:
Also a interesting DIY satellite project is Outernet
This project requires the same hardware as the above project but this project also provides a option to buy custom hardware to receive the signals.
They send 20MB of data direct from there satellite for you to receive everyday.
You can do suggestions for data to be included through there website.
https://outernet.is/
https://en.wikipedia.org/wiki/Outernet
You forgot the measurement of deforestation progress! :D
IMHO it's far more important than knowing how much oil we have left ;)
You can read about it in part 1 ;)
damn didn't see this is part 2. You already at the word amazing lol
Hi @fredrikaa Really interesting post! :)
I’m just wondering, in regards to measuring the world’s oil reserves, what is the average uncertainty in the measurements for the oil content of a silo when using the internal shadow method?
The exact precision at which the image data itself can predict oil volumes is unknown to me (It's a company called Orbital Insight that produce the service. And the exact measures is sure to be a company secret). It is certainly used together with other data sources to enhance the predictive power of the model.
Hope that helps answer your question :)
Always fascinating to learn more space news.
Haven't checked the ESA for quite a while, so sorry if I go a tad bit off-topic, but I'm curious wether the Moon Colony challenge has a winner and if so what does the project entail? Maybe this can be an idea for a future post?
I will definitely go into depth on my thought about realising a moon colony in the future!
As for now, it is only a call for ideas and the (relatively) new General Director testing out the interest to participate in the idea.
So there is no draft or anything yet? Because, if I recall correctly the contest was launched in 2014 (?) and I would've thought some ideas might have gotten some consideration by now.
Of course I'm not expecting actual result already, but some rough outlines for a project.