Optimizing Photovoltaic Performance by Kinetic Quenching of Layered Heterojunctions
INTRODUCTION
Polymer solar cells (PSCs) are a kind of potential clean-energy
technology, which holds promise for manufacturing lightweight
and highly flexible devices such as portable electronic products
and building-integrated photovoltaics.[1−5]
Although the power
conversion efficiency was dramatically improved recently, it has
not yet broken through the requirements of commercial
markets due to the limitation on the mechanism of charge
carrier generation and transport.[6,7]
To date, a considerable
effort has been devoted to creating novel π-conjugated
polymers to improve photovoltaic performance. In contrast,
understanding the morphology effect on PSC performance and
formulating basic rules that guide morphology optimization
need to be further enhanced.
Optimizing the morphology is indispensable for the suc-
cessful preparation of PSCs with outstanding performa-
nce.[8−12]
The PSC performance can be quantitatively correl-
ated with phase purity and Flory-Huggins parameters.[13]
In-
sufficient phase separation in PSCs can lead to performance
deteriorations. However, a larger repulsion between donors
and acceptors can lead to over-purification of mixed domains
and decreased PSC performance.[14]
For example, Ade et al.
observed that the average power conversion efficiency shows
a substantial drop as the composition of the amorphous
mixed domains is below the percolation threshold.[15]
Ye et al.
recently found that such a problem can be resolved by kinet-
ically quenching the mixed domains to an optimal composi-
tion close to the percolation threshold.[16]
Despite this, funda-
mental guidelines are still required to optimize PSC perform-
ances with optimal mixing morphologies. Combining ther-
modynamic effects and kinetic controls can assist the design
of heterojunctions with varied mixing morphologies.[16]
The
thermodynamics can drive the phase separation of donors
and acceptors in PSCs, and the quench by kinetic control can
"lock-in" instantaneous phase-separated morphologies. Re-
cent attention has been paid to the stability of such mixing
morphologies.[17−20]
However, little is known about the kinet-
ic route to control mixing morphologies and the influence of
mixing morphologies on PSC performances. Quantifying the
impact of mixing morphology on device performance by de-
veloping kinetic control rules is the key to optimizing the het-
erojunction structure and promoting power conversion effi-
ciency.
Theoretical computation and simulation, such as kinetic
Monte Carlo simulations, can avoid trial-and-error experi-
ments and improve experimental efficiency. The drift-diffu-
sion model, requiring less computational cost than the kinet-ic Monte Carlo model, can predict the photovoltaic perform-
ances.[21,22]
Ganesan et al. predicted the photovoltaic per-
formance of rod-coil block copolymers by inputting the den-
sity profile and orientational order parameter obtained from
self-consistent field theory calculations into the drift-diffu-
sion model.[23]
The drift-diffusion formalism allows them to
account for spatially varying morphologies and the aniso-
tropy in charge transport within an internally consistent
framework. Dissipative particle dynamics (DPD), coupled with
the drift-diffusion model, is an alternative to study the PSC
performances.[24−26]
We have applied the DPD simulation to
study the phase behavior of various polymer systems and
used the drift-diffusion formalism to calculate the photovolta-
ic performance of block copolymer solar cells.[24,25]
The com-
putation showed that the DPD coupled with a drift-diffusion
model is a powerful tool for predicting performance and
peering into the internal mechanism.
In this work, we conducted an in silico layer inter-diffusion
experiment in the framework of DPD simulations. One-step
and two-step quench strategies, based on thermodynamic
driving and kinetic controlling, were proposed to regulate the
mixing morphologies. The density information obtained from
the DPD simulation was input to the drift-diffusion model to
predict the photovoltaic properties. One-step quenching res-
ults demonstrated that optimal interfacial width results in the
excellent photovoltaic performance of layered heterojunc-
tion. We discovered that the two-step quench could help to
form rough interfaces and small-length-scale islanded struc-
tures connected with the interfaces, which are conducive to
the improvement of photovoltaic performance. Our predic-
tion shows good agreement with experimental findings and
can explain the impact of PSC morphology on performances
quantitively.
COMPUTATIONAL METHODS
We developed a multiscale method combining dissipative
particle dynamics (DPD) with a drift-diffusion model to
investigate the PSC photovoltaic performance. The DPD was
first conducted to obtain the structure of polymer blends
consisting of donors (D) and acceptors (A). And then, the
structures were input into the drift-diffusion model to calculate
the photovoltaic performance. The DPD method and drift-
diffusion model are given as follows.
DPD Method
The DPD, firstly proposed by Hoogerbrugge and Koelman, is
a stochastic simulation technique for simulating the dynamic
and rheological properties of complex fluids.[27]
The details of
the DPD method can be found in Section 1 in the electronic
supplementary information (ESI). A DPD bead represents a
cluster of atoms/molecules in the method.[28−33]
The motion of
DPD beads obeys the Newton equation of motion. The force
applied to each bead comprises non-bonding forces and
bonding forces. The non-bonding force fα
applied on the α
th
bead includes a conservative force , a dissipative force ,
and a random force . The neighboring beads in each
polymer are connected by a harmonic spring potential
with the spring constant kb=100 and the
equilibrium bond length req=0.86rc
. All physical quantities are in
reduced units, where the units of time, length, mass, and energy
are τ, rc
, m, and kBT, respectively. The physical lengths in our
system were established as follows. We equated rc
to 2 nm to
build a bridge between simulation parameters and
experimental values. The thickness of layers sandwiched
between two electrodes (Lthickness) was set to 100 nm, and the
width Lwidth of each A (or D) layer is 20 nm.
We conducted the DPD simulations in a box with periodic
boundary conditions. The NVT ensembles were adopted in
the simulation, and the time step was set as Δt=0.002τ. Con-
sidering the finite size effect, we chose the A (or D) polymer
with six DPD beads, the size of which should be much smaller
than the box size. The number of A (or D) polymers is 2000 to
ensure that the number density of DPD beads is 3rc
−3. To sim-
ulate a layer inter-diffusion experiment, we arranged the D
and A layers periodically with the lamellae perpendicular to
the electrode (see the inset of Fig. 1a).[13]
The interaction
strengths between the same kind of DPD beads are
aAA=aDD=25. In the beginning, the simulation with aDA=100
was performed for 1.0×10⁴
DPD steps to relax the polymers in
each layer and minimize the interface of mixed D/A polymers.
The layered heterojunction model was prepared for sub-
sequent kinetic quenching simulation. Then, the interaction
strength is reduced to aDA=25 to allow the inter-diffusion of
the polymers. After t1
, the simulation was stopped to mimic a
one-step in-depth quenching process, and the simulation
structures were taken as the one-step quenching structures.
The mixed morphology can exhibit various states when we
adopted different processing methods. In the two-step
quench simulation, the interaction strength aDA was in-
creased after the simulation for t1
, and then another simula-
tion was performed for t2
, as illustrated in Fig. 1(a). The varied
interaction strengths aDA correspond to various blending
temperatures.
Drift-diffusion Model
We calculated the photovoltaic performances of PSCs with
various structures by solving drift-diffusion equations.[34,35]
The
details of the drift-diffusion model are provided in Section 2 in
ESI. We solved the drift-diffusion equations numerically by finite
difference methods. The equations are first discretized in three
dimensions and then solved by the double conjugate gradient
method and Gauss-Seidel iteration method. The parameters of
the model used in the photovoltaic calculation are listed in
Table S1 (in ESI). Most of the parameters are typical for
polymeric materials used in PSCs.[23−25,36]
In solving drift-
diffusion equations, the periodic boundary conditions were
applied in the x- and y-directions parallel to electrodes. In
contrast, the non-periodic boundary conditions in the z-
direction normal to electrodes were set (for details, see Section 2
in ESI).
RESULTS AND DISCUSSION
The present work focuses on building the relationship between
the mixing morphology and photovoltaic performances of
polymer solar cells (PSCs). We considered a PSC system
consisting of two kinds of homopolymers, that is, donor (D)
polymers and acceptor (A) polymers, and used a multiscale
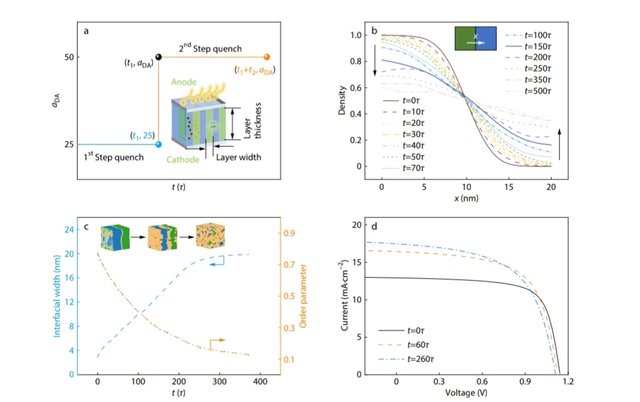
Fig. 1 (a) Schematic of the simulation method for one-step quenching and two-step quenching processes. In one-step quenching,
aDA=25, t=t1
, and t2=0. In a representative two-step quench, the aDA is 25 and 50 before and after t1
, respectively. The inset shows the
initial simulation model of PSC device, where the layer thickness and the layer width are 100 and 20 nm, respectively; (b) One-
dimensional density profiles of acceptors along the x-direction normal to the interface at various blending time; (c) Plots of interfacial
width and order parameter as a function of blending time t. The insets show the corresponding mixing morphologies, where blue, green,
and brown colors are assigned to the D domain, the A domain, and the interface, respectively; (d) Plots of output current as a function of
applied voltage for the layered heterojunction obtained at various blending time in a one-step quench.
method coupling DPD with drift-diffusion models to explore the
morphology effect on PSC photovoltaic performances.[24,25]
The
in silico experiment of layer inter-diffusion was first performed
using DPD simulations, and then the photovoltaic performance
of the PSC system was investigated by solving drift-diffusion
equations.
To simulate a layer inter-diffusion experiment,[13]
we ar-
ranged the D and A layers periodically with the lamellae per-
pendicular to the electrode (Fig. 1a). We stimulated both the
one-step quench and two-step quench processes to obtain
layered heterojunctions with varied mixing morphologies. In
a one-step quench simulation, the blending time is continu-
ously adjusted to gain layered heterojunction with various in-
terfacial widths. In a two-step quench simulation, we can
achieve the layered heterojunction with sufficient phase-sep-
arated mixed domains. The details can be found in the Com-
putational Methods section.
One-step Quench
This subsection adopted a one-step quench method to achieve
heterojunction structures with various interfacial widths and
explored the relation between photovoltaic performances and
interfacial width. In the initial period of quenching simulation,
the interaction strength aDA between D and A polymers was set
as 25, which equals the interaction strengths between the
beads of the same type, to simulate the inter-diffusion of D and
A polymers at high temperature. As time goes on, the D/A
interface gradually widens through inter-diffusion, and the
layered heterojunction slowly evolves toward a thoroughly
mixing state (mixing heterojunction). To generate layered
heterojunctions with various interfacial widths, we stopped
the simulation at different time to mimic the quenching process
where the temperature drops rapidly to freeze the movement of
polymer chains. For example, melts of polymer blends are
frozen into a glass below the glass transition temperature. The
time when we stopped the simulation is referred to as blending
time.
Fig. 1(b) shows the density profiles of A polymers obtained
at various blending time. As shown, the fraction of A poly-
mers in the acceptor-rich domain decreases as the blending
time increases. As a result, the degree of mixing increases,
and the D/A interface broadens. To qualify such a variation,
we calculated the order parameter and interfacial width at
various blending time (the definitions of order parameter and
interfacial width are given in section 4 in ESI). The result isshown in Fig. 1(c), where the orange and blue lines corres-
pond to the order parameter and the interfacial width, re-
spectively. As the blending time increases, the interfacial
width shows a nearly linear increase and then keeps un-
changed. Different from the interfacial width, the order para-
meter gradually decreases. This result implies that the vari-
ation of order parameters can be inversely related to the
change of interfacial width. A plot of order parameters as a
function of interfacial width proves such a relationship (Fig.
S1 in ESI). Therefore, we only examined the effect of the inter-
facial width on photovoltaic performances in the following.
We also found the D and A polymers are almost uniformly
mixed (mixing heterojunction) at a long blending time (e.g.,
370τ).
The J-V curves were calculated for the layered heterojunc-
tions obtained at various blending time, under applied
voltages from −0.45 V to 1.3 V, using the drift-diffusion mo-
del. As the blending time increases, the short-current density
(JSC) increases, and the open-circuit voltages (VOC) decrease
(Fig. 1d). The output power first increases and then decreases
as the applied voltage increases (Fig. S2 in ESI). The layered
heterojunction generated at the blending time of 60τ pos-
sesses the most superior maximum output power among the
photovoltaic devices obtained at three blending times. The
photovoltaic performances, including JSC, VOC, fill factor (FF),
and power conversion efficiency (η), can be calculated from
the J-V curves to characterize photovoltaic devices. Since the
variation of mixing degrees can be related to the change of
interfacial widths (Fig. S1 in ESI), we focused on the depend-
ence of performances on the interfacial width. Fig. 2 shows
the variation of JSC, VOC, FF and η as a function of the interfa-
cial width. As shown, the photovoltaic performances exhibit
different responses to the change in interfacial width. The JSC
increases markedly with increasing the interfacial width, fol-
lowed by a slight variation of the JSC (Fig. 2a). Compared with
JSC, the values of VOC are less sensitive to the variation of inter-
facial width (Fig. 2b). And the FF shows a decrease with in-
creasing interfacial width, which resulted from the enhanced
recombination of charge carriers (Fig. 2c). The η first in-
creases and then decreases as the interfacial width increases
(Fig. 2d). The optimal interfacial width is ca. 7 nm for the D/A
heterojunction photovoltaic device. At optimal conditions,
the corresponding order parameter is 0.54 (Fig. S1 in ESI). As
the interfacial width is smaller than 7 nm, the charge carrier
generation dominates the charge carrier recombination. In
contrast, the charge carrier recombination governs the
photovoltaic efficiency as the interfacial width becomes large.
To capture the underlying mechanism enhancing the
photovoltaic performance of the layered heterojunction with
intermediate interfacial width, we calculated two-dimension-
al distributions of acceptor volume fraction, exciton density,
charge carrier generation rate, and charge carrier recombina-
tion rate. The two-dimensional distribution was obtained by
projecting the three-dimensional distribution of acceptor
volume fraction, exciton density X (m−3), charge carrier gener-
ation rate Geh (m−3·s−1), and charge carrier recombination rate
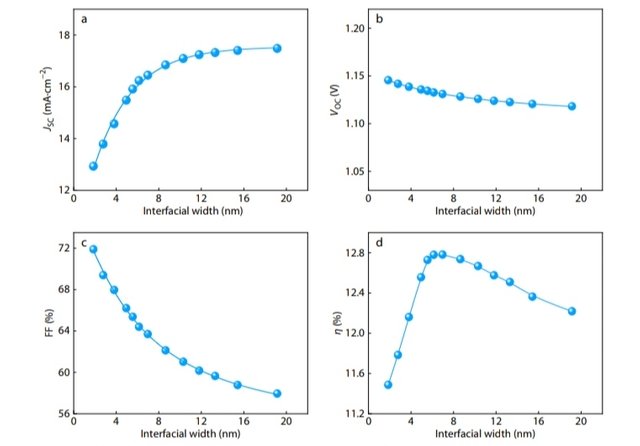
Fig. 2 Plots of (a) JSC, (b) VOC, (c) FF, and (d) η as a function of the interfacial width of heterojunction PSCs in a one-step quench. The
width of each layer is 20 nm, and the interaction strength aDA between D and A polymers is 25.
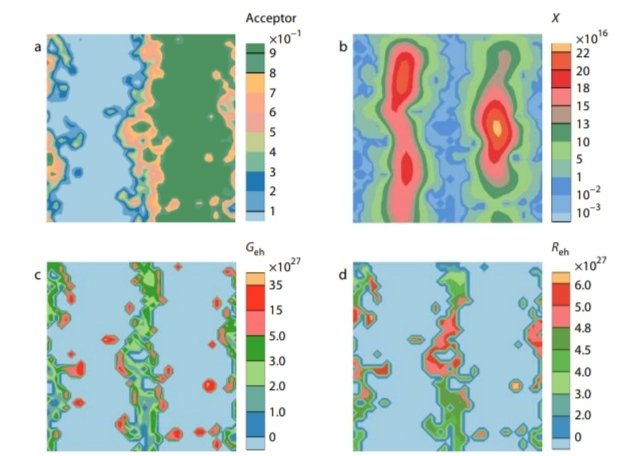
Fig. 3 Two-dimensional distributions of (a) acceptor volume fraction, (b) exciton density (m−3), (c) charge carrier generation rate (m−3·s−1),
and (d) charge carrier recombination rate (m−3·s−1) along x- and z-coordinates. The layered heterojunction has an interfacial width of 7 nm.
Reh (m−3·s−1) on the x-z plane because their distributions on
the y-axis are reproducible. The results presented in Fig. 3 are
for the polymer blends with an interfacial width of 7 nm. As
shown in Fig. 3(a), the interface between D and A polymers is
rough, which results in a substantial increase in the specific
interface area of the heterojunction compared to planar het-
erojunction. The concentration of excitons near the interface
drops significantly compared with those in the relative pure
domain (Fig. 3b), which indicates the separation of a large
number of excitons at the D/A heterojunction interface.
Based on Figs. 3(c) and 3(d), we can intuitively observe the
distribution of generation rate Geh of charge carriers and re-
combination rate Reh of charge carriers, where larger values
near the interface and smaller values in the pure domain ap-
pear. One can see that the generation rate Geh of charge carri-
ers at the interface is higher than that inside the interface (Fig.
3c). The interface offers a central site for separating excitons
and recombining charge carriers. Compared with the inter-
face, the relative pure domain is a better channel for carrier
transport in the photogeneration process for less doping of
electrons or holes. The tradeoff between charge carrier gener-
ation and charge carrier recombination determines the op-
timal interfacial width. In addition, the interfacial roughness
enables a portion of separated carriers to transport through
pure domain channels, further increasing the performance.
The photovoltaic performances are dependent on the in-
teraction strength aDA and layer width Lwidth. As the layer
width increases, the JSC decreases, but the VOC and FF in-
crease (Figs. S3a−S3c in ESI). In addition, the optimal η de-
creases with the increases of layer width (Fig. S3d in ESI). The
increase of layer width reduces the specific interfacial area for
exciton separation, leading to the reduced η. As the layer
width increases, it requires more blending time to obtain the
optimized specific interfacial area through inter-diffusion. As
a consequence, the optimal η shifts to a long blending time
as the layer width increases. The photovoltaic performance at
the longer blending time shows no evident difference be-
cause the A and D polymers are homogeneously mixed
(aDA=25).
The interaction strength aDA can be associated with the
blending temperatures in the one-step quench experiment.
Higher interaction strength means a lower blending temper-
ature. The JSC decreases, and the VOC and FF increase as the
aDA increases (Figs. S4a−S4c in ESI). At the high aDA value, e.g.,
aDA=32.5, the photovoltaic performances are nearly un-
changed, which results from deteriorative compatibility
between the D and A polymers. The temporal variation of η
depends much on the aDA value (Fig. S4d in ESI). As the aDA is
not very high, the η changes non-monotonically with time, in-
creasing first and then decreasing until it keeps unchanged.
The optimal η increases and shifts towards long blending
time with improving the aDA. As the aDA is high, e.g., at
aDA=30, the η varies monotonically with blending time—the
η increases first and then stays nearly unchanged. Note that
the mixing heterojunction and layered heterojunction are ob-
tained at high and low blending temperatures, respectively,
as the blend reaches equilibrium. At a low temperature, the η
for the equilibrium structures obtained at long blending time
decreases with increasing aDA values, which could be ascribed
to the interface narrowing in layered heterojunctions at a
higher interaction strength.
Two-step Quench
In this subsection, we further optimized the layered hetero-
junction PSCs by secondary phase separation of mixingdomains. A two-step quenching process was proposed to
modulate the phase separation and, therefore, the photovoltaic
performance (Fig. 1b). In the two-step quenching process, the
blending time t includes a high-temperature mixing time t1
and
a low-temperature separating time t2
. At a time shorter than t1
,
the aDA is 25, allowing D and A polymers to mix via inter-
diffusion at a high temperature. This process is the same as in
the one-step quenching process. At a time longer than t1
, the
aDA increases to 50 to drive microphase separation between D
and A polymers. This case mimics the phase separation of
polymer blends at a low temperature (still in the molten state).
At the time of t1+t2
, we stopped the simulation to mimic an in-
depth quenching process, where the temperature is decreased
to, for example, below glass transition temperature to freeze
polymer chains. Taking the one-step quenching process as the
benchmark, we explored the effect of secondary phase
separation on photovoltaic performances.
In the two-step quenching, the blending time t varies to
obtain morphologies with various separation/mixing degrees.
We then calculated the photovoltaic performance of these
layered heterojunctions under different blending time t. The
result is presented in Fig. 4(a). The photovoltaic performance
curve from 0 to t1
is represented by a solid blue line, which
shows no difference from the performance curve of the one-
step quench. The dashed black curve represents the photo-
voltaic performance curve from t1
to t1+t2
. For each t1
(blue
dot), we selected the optimal photovoltaic efficiency η
at
the second-step quench and represented it with an orange
dot. We connected the orange dots into a curve to represent
optimal photovoltaic efficiency curves after two-step quen-
ching treatment under various conditions. As the t increases,
the optimal photovoltaic efficiency increases initially and
then decreases slowly, whose trend is similar to that of a one-
step quenching process. With increasing t1
, the time t2
re-
quired to achieve the optimal photovoltaic efficiency η
in-
creases, especially in the late stage (t1>70τ). The result im-
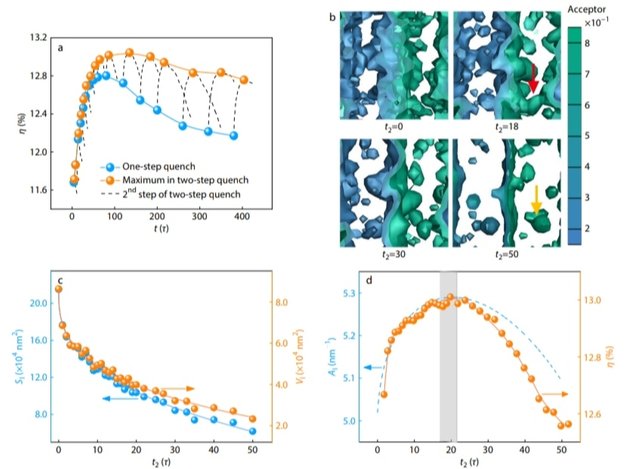
Fig. 4 (a) Plots of η as a function of time t for the two-step quenching process, in which high-temperature mixing time t1
and low-temperature
phase separating time t2
are adjusted continuously. The solid blue curve and dashed black lines refer to the first-step and second-step quenching
processes, respectively. (b) Front view of the layered heterojunction obtained at t2=0, 18, 30, and 50, respectively, where the high-temperature
mixing time t1=120τ. The red and yellow arrows indicate the island connected to the interface and isolated island, respectively. (c) Plots of volume
V and interfacial area S of the heterojunction as a function of the low-temperature phase separating time t2
. (d) Plots of specific interfacial area A
deduced from S(t2
)/V(t2
) and photovoltaic performances as a function of low-temperature phase separating time t2
. The high-temperature mixing
time t1
is 120τ.
plies that the two-step quenching treatment contributes
much to the performance enhancement. Compared with the
best photovoltaic performance of 12.78% in the one-quench
process, the two-step quenching treatment can improve the
device to higher photovoltaic performance, ca. 13.05% at
t1=120τ and t2=18τ.
We found that the interaction strength has a less marked
effect on the optimal photovoltaic efficiency as the interac-
tion strength is higher, for example, at aDA=40, 50, and 60
(Fig. S5 in ESI). The low-temperature phase-separating time t2
required to achieve optimal photovoltaic efficiency de-
creases for each case as the interaction strength increases.
However, as the interaction strength is lower, e.g., at aDA=30,
the optimal photovoltaic efficiency shows an evident differ-
ence from those of higher interaction strengths. A much
longer phase-separating time t2
is required to achieve optim-
al photovoltaic efficiency.
The improved photovoltaic performance can be related to
the secondary phase separation between donor and accept-
or polymers in the mixing domains. Fig. S6 (in ESI) shows the
order parameter as a function of separating time t2
. As shown,
the order parameter increases with time, and the donor and
acceptor polymers become more phase-separated. The op-
timized performance was obtained at an intermediate order
parameter of 0.64, implying that either insufficient phase sep-
aration or the over-purification of the acceptor- or donor-rich
domains can lead to performance deteriorations. Since the
phase separation can occur both at the interface and within
A- and D-rich domains, the mechanism behind the perform-
ance optimization needs to be explored further.
To obtain a deep insight into the internal mechanism un-
derlying the enhanced photovoltaic performances at t2=18τ,
we captured the morphologies of the D/A heterojunction at
various low-temperature separating time t2
. The results are
shown in Fig. 4(b). As shown, as t2
increases from 0τ to 18τ,
the interfacial region gradually narrows, indicating the phase
separation. Moreover, the phase separations within D and A-
rich domains also happen, leading to a series of small-length-
scale islanded structures. At that time, the D/A interface is
highly structured and rough, and the phase-separated small-
length-scale islands are connected with the interface to form
continuous structures. Such an arrangement results in in-
creased interfaces for exciton separation and efficient pas-
sages for charge transport. Therefore, the η reaches the
highest value. As t2
further increases, the phase separation
goes on, and the interface becomes less structured and nar-
row, leading to a decreased exciton separation efficiency. At
t2=50τ, a flat, thin interface appears between D- and A-rich
domains. Moreover, the small-length-scale islands are inde-
pendent of the interface and become "isolated islands" with-
in D- or A-rich domains, resulting in the loss of effective trans-
port channels. The less structured interface, narrow interfa-
cial width, and isolated small-length-scale islands are harmful
to the exciton separation, leading to decreased power con-
version efficiency. The two-step quench provides a buffer for
making the interface rough and generating small-length-
scale islands connected to the interface at a lower temperat-
ure before the kinetic quenching, leading to improved per-
formance.
To further quantify the impact of interfacial roughness on
device performance, we analyzed the morphology features
of the D/A heterojunction by Minkowski functionals V and S
at t1=120τ. As shown in Fig. 4(c), with t2
increasing from 0τ to
50τ, the volume V and interfacial area S of the heterojunction
present the same tendency to go down faster at first and then
decrease slower. In this process, the acceptor and donor poly-
mers tend to come together, and the purity of the acceptor-
or donor-rich domain increases. We obtained the curves of
specific interfacial area AI
with time t2
from S(t2
)/V(t2
), which
is shown in Fig. 4(d). The curves of the specific interfacial area
of the heterojunction and the photovoltaic performance
show similar trends, both of which increase initially and reach
a peak in the dash region (t2
is around 18τ), and then drop off.
The result implies that an increase in specific interfacial areas
is a critical factor for improving photovoltaic performance.
The low-temperature phase separation in the two-step
quench plays a role in modulating the specific interfacial area.
Comparison with Existing Experimental Observations
There is some experimental evidence available to support the
simulation results. Ye et al. recently carried out a bilayer inter-
diffusion experiment to gain insight into the relationship
between interaction parameters and photovoltaic performan-
ces of organic solar cells.[13]
They established a quantitative
"constant-kink-saturation" relation between Flory-Huggins
parameter χDA and the fill factor FF in organic solar cells. To
make a comparison, we calculated the FF for the equilibrium
D/A blends obtained at various interaction strengths aDA
through one-step quench simulations for a long bending time.
χDA = (0.286 ± 0.02)Δa
Fig. 5 shows the plot of fill factors as a function of Flory-
Huggins parameter χDA between donor and acceptor. The χDA
is related to aDA in terms of .
[37]
In the
figure, the blue and orange dots correspond to the experi-
mental and simulation results, respectively. Similar to the ex-
perimental findings, the simulation also revealed a "constant-
kink-saturation" relation between FF and χDA; that is, as the
χDA increases, the FF is first almost unchanged, then increases
sharply, and finally keeps nearly unchanged (Fig. 5). However,
the FF in the simulation is higher than that in experiments.
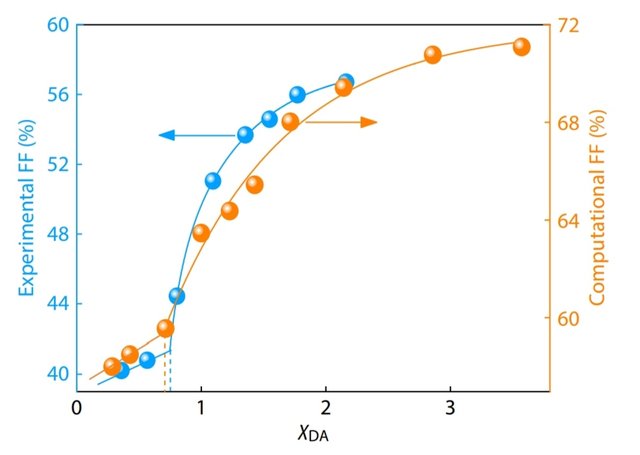
Fig. 5 Plots of fill factor FF as a function of Flory-Huggins parameter
χDA for layered heterojunctions obtained in a one-step quench. The
experimental results (blue dots) were adapted from Ref. [13] with the
permission of Nature Publishing Group.
This difference could result from the discrepancy between the
experimental sample and the simulation model. Different
from the all-polymer system in simulation, the experimental
model adopts the PCDTBT:PC71BM system. The molecule ac-
ceptor phases diffuse into donor phases faster, and the donor
region has a lower purity, which results in the rise of carrier re-
combination. The donor composition in the acceptor-rich do-
mains is unequal to the accepter composition in the donor-
rich domains in the experiment. However, in our simulation,
the accepter-rich and donor-rich domains are symmetric, and
both of them can contribute to the FF, resulting in an in-
creased FF. Despite that, the "constant-kink-saturation" fea-
tures are consistent. We found that a sharp increase in FF hap-
pens as χDA is higher than ca. 0.75. This threshold value, asso-
ciated with the phase separation between donors and ac-
ceptors, is similar to that (ca. 0.72) revealed in the experiment.
The consistency with experimental results implies that the
current simulation is a practical approach to reproducing the
experimental observations.
Recently, Ade et al. observed a substantial drop in power
conversion efficiency as the mixed domain is over-purified.[15]
Reducing the interaction strength between acceptors and
donors can avoid the over-purification of the domains.
However, higher interaction strength is still needed for phase
separation and, thus, optimal performance. Therefore, there is
a need to kinetically quench the mixed domains to a compos-
ition close to the percolation threshold for achieving optimal
performance if the molecular interaction of constituent ma-
terials is too repulsive. Ye et al. recently determined the
quench depth of an organic solar cell to achieve optimal per-
formance and stabilize the mixing morphology.[16,38]
The es-
sence of their work is to create percolation structures with
continuous channels by a kinetic quench. In our simulation,
we found that the connectivity of islanded structures in D/A
domains with the interface is crucial to the performance en-
hancement (Fig. 4b). The formation of islands can increase the
interface, whereas the connectivity with the interface can of-
fer transport channels. Such an observation is consistent with
the opinion that sufficient electron pathways for transport are
a critical morphological requisite for achieving desirable PSC
performances, although the length scale we focused on is
much smaller than that of mixed domains in the experiments.
Similar to polymer blends, block copolymers can also yield
various ordered morphologies. Provided that the interfacial
width and domain size of the lamellae formed by block co-
polymers are similar to those of mixing morphology, the
photovoltaic properties could be the same. We can expect
the variation of photovoltaic properties by changing the in-
terface width and domain size via varying the chemistry of
blocks and the length of block copolymers. Changing the
chemical species and polymer lengths requires synthesizing
new polymers, which usually poses challenges. In contrast,
the mixing morphology can be readily obtained by kinetic-
ally quenching the polymer blends, although the quench sys-
tem is generally more unstable than the block copolymer sys-
tem. Overall, the block copolymers can achieve similar photo-
voltaic performance with polymer blends, but their morpho-
logies are regulated through different routes.
In this work, we discovered that appropriately modulating
interfacial width, interfacial roughness, and islands' con-
nectivity with interfaces can enhance photovoltaic perform-
ance. We proposed two quenching methods to adjust these
structures of the layered heterojunctions. The work revealed
that a specific buffer time for blending and secondary phase
separation could increase the interfacial area and form elec-
tron transport pathways, leading to enhanced photovoltaic
performance. Recent observations demonstrated that
quenching to the percolation threshold is critical to perform-
ance improvement.[16,38]
Our work adds a new opinion to the
current findings: providing a buffer at a lower temperature
before the kinetic quenching can further increase photovolta-
ic performance.
CONCLUSIONS
The DPD method, coupled with the drift-diffusion model, was
employed to study the mixing morphology effect on the
photovoltaic performance of layered heterojunction PSCs. We
performed an in silico layer inter-diffusion experiment and
designed two quench approaches to regulating the mixing
morphology of layered heterojunctions, that is, one-step
quench and two-step quench. In the one-step quench, the
layered heterojunction with intermediate interfacial width
exhibits an optimal photovoltaic performance. We further
enhanced the power conversion efficiency of the layered
heterojunction by modulating the mixing morphology with a
two-step quench method. We discovered that the interfacial
width, interfacial roughness, and small-length-scale island
structures formed within acceptor- and donor-rich domains
combinedly affect the power conversion efficiency. Our work
delineates the effect of quenching processes on photovoltaic
performance, which could be beneficial to the design and
quantitative optimization of active layers.
NOTES
The authors declare no competing financial interest.
This is a one-time notice from SCHOOL OF MINNOWS, a free value added service on steem.
Getting started on steem can be super hard on these social platforms 😪 but luckily there is some communities that help support the little guy 😊, you might like school of minnows, we join forces with lots of other small accounts to help each other grow!
Finally a good curation trail that helps its users achieve rapid growth, its fun on a bun! check it out. https://plu.sh/somland/