How I Timed A Ripple Entry Today Succesfully
I am still thinking of how to develope this channel so it doesn't just mirror my main channel on Tradingview, were I analyse Cryptocurrencies daily. One aspect of trading that never really enters these analyses is how to time an entry.
Now there are different types of trades, depending mainly on the time horizon but also on the price range of the trade. Many people use oscillators for entries. They can be effective but they can also fail much more than one would expect.
Divergence
Divergence is a technique that many experienced traders use, if they are to enter a trade, especially a shorter one. I am not going to elaborate on the subject too much and there are different ways how to detect it. One is to just use an oscillator like RSI or MACD, which will reflect price divergence. This is what I usually look at, the MACD, to detect both regular and hidden divergence. But one indicator that I really like is the Chaikin indicator, which also includes volume. One can find volume divergence just by looking at the volume and compare it to the price chart and this can be useful, but Chaikin also includes the type of divergence you will see by looking at the RSI or MACD indicators.
How to detect Divergence?
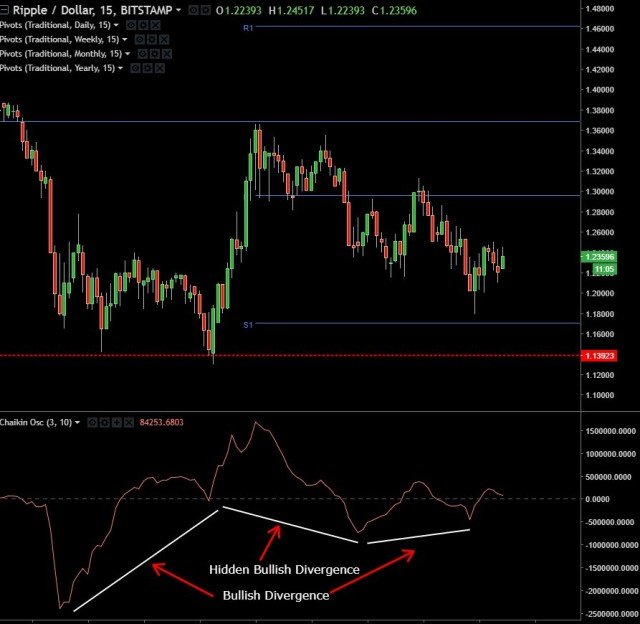
1 Bullish Divergence: Price makes a lower low while the indicator makes a higher low.
2 Hidden Bullish Divergence: Price makes a higher low while the indicator makes a lower low
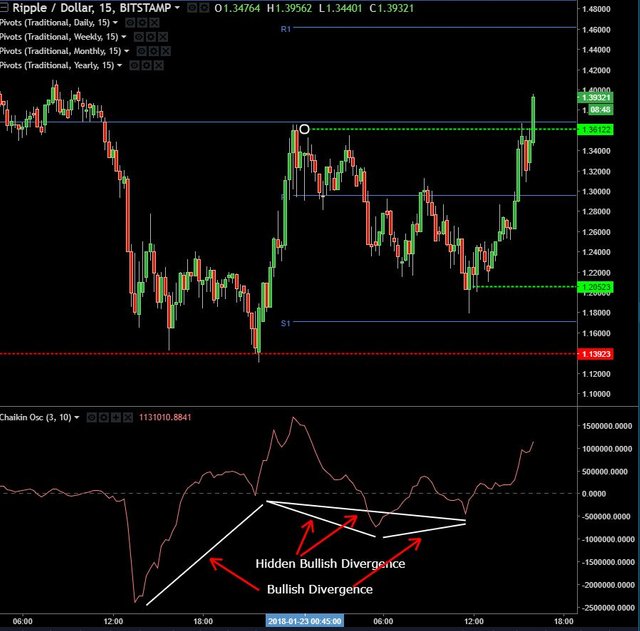
I was looking for a shorter trade today and had my eyes on Ripple. On the M15 chart I discovered a very nice formation of two Bullish Divergences and one Hidden Bullish Divergence (actually two, one is not marked on the chart below). I discovered it just at the right time and took a long position at 1.20. I set the target at 1.35 for half the position (the previous high) and the other half I would trail by placing a sell order by the entry at 1.20 and then move this stop up if price continues to run higher. By doing this I will protect my capital if market decides to go against me and I will lock in profits if price moves higher.
(please click on the charts to enlarge them)

The skilled eye will notice that the first divergence was stronger and gave a really sharp move up. But I missed out on that trade. instead I had to settle with the second Divergence, that came after the Hidden Bullish Divergence.
The chart below shows how price took off as one could expect from the divergence. These signals don't always work out but many times they do, and if they don't, you often have a chance to sell at the entry price and thus protect your capital, which is your main goal at all times. I should mention that I have a protective stop when I enter the trade, and once it moves in the right direction, I will move the stops to break even (the entry level).
My advice to daytraders is to think about the main objective: To protect your capital. By acknowledging that you cannot know what the market will do and that you don't trade on your emotions about where price will go or let the ego run the show, but instead rely completely on the technical signal and how to manage your trade and protect your capital, you will become a succesful trader. You will have patience and follow your plan no matter what. Don't let greed take the best of you. Reward yourself not if you make profits, but instead if you followed your plan. This is how a professional trader acts and think. Discipline may be booring to some, but it pays off in the long run.
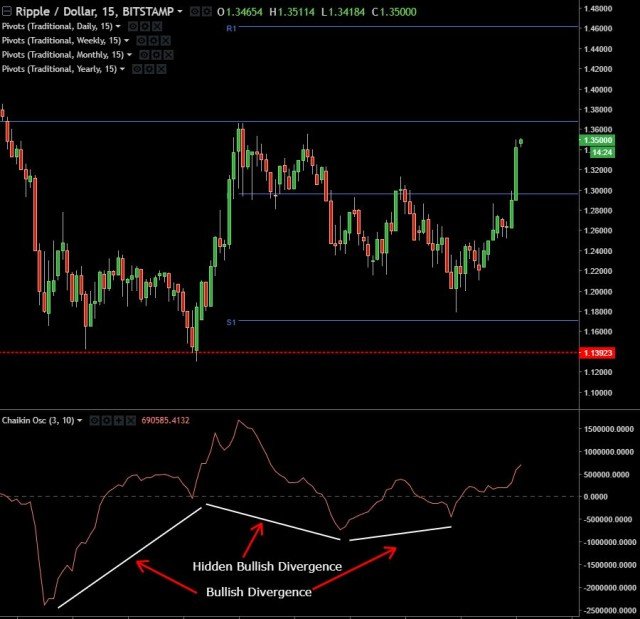
In the final image below, you can see how price took out the previous high, which was my first target and continues higher. So I could trail the stop up after the first target was reached and that way lock in profit also on the second half.

Feel free to follow me on Tradingview under alias "CapMoore"
https://www.tradingview.com/u/CapMoore/
