[Technical Analysis] STRONG SUPPORT AREA ??? STEEM-BTC (POLONIEX)
This is my analysis for market STEEM-BTC on Poloniex market (I use Tradingview to use tool)
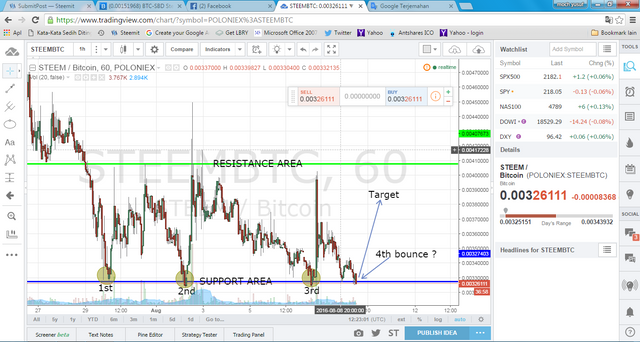
See the chart below, I use timeframe 1H.....

(screenshoot on my PC)
above we know that there is a strong support area at 0.0032 price level, already happened three times false break in the area ..this indicates that the support area is very difficult to pass, because this is the lowest point possible level prices steemit .. Then I gave 3 small circle on a false break, the first on 30 July 2016, the second in the 2nd Agust 2016, third in 2016 Agust 7th .. If that is the price of making false break back in the fourth, then the price will go up to the 0.004 price level (which I mark with "target" or it could be higher, namely to "resistance area").

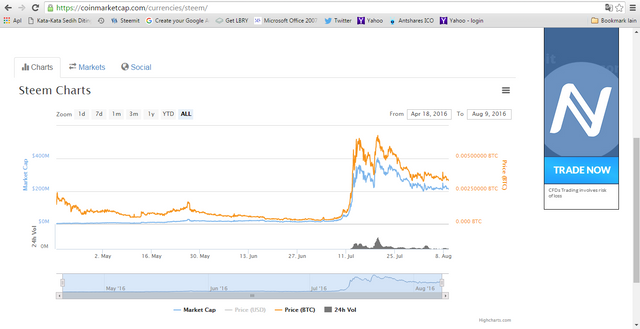
( steem chart on coinmarketcap )

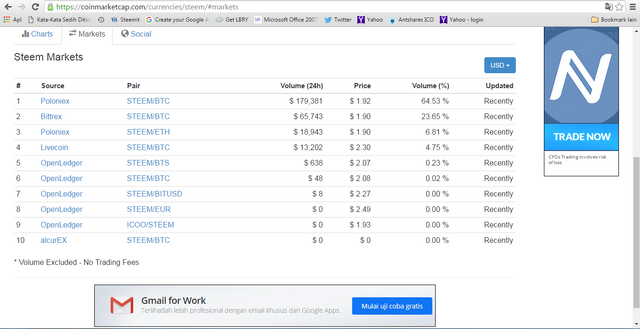
( steem market on coinmarketcap )
The largest volume in the market Poloniex
Well is in the running price will now form the fourth false break? or even break through the strong support area? Please wait for my next post ...
by @moch-yusuf
I know damned little about technical charting, but the highs seems to be lower as it progresses. I thought a break to downside more likely when that happens?
its minor resistance, not major resistance...I use it cause on Poloniex timeframe 1D or 4H too short to analysis...Thanks
Great Posting, nice analys :)
Thanks bro