WHAT COMETH THIS WAY?

2018 has been a record breaking year for the U.S. stock market. It has seen an all time high of 26,951.81 points on October 3rd. Just last Monday the Dow Jones experienced the worst market drop on a Christmas Eve in the history of the stock market. President Trump urged people to buy the dip. Understand he's telling people to buy a market that is 5,000+/- points off the top. If that wasn't adrenaline pumping enough for you The Donald (POTUS) and the "Plunge" Team orchestrated a 1,000+ point rally the day after Christmas. That was pure market manipulation!
If The Donald knows "stock markets" why didn't he tell people to sell their stock on October 3rd, when the market began the sell off? Hmmm? Here's the skinny as I see it. The market topped on the October 3rd as mentioned at the price stated above. On December 19th, the market sold below the February, 2018, market support and then plummeted to the Christmas Eve low before the The Federal Reserve and U.S. Government began the manipulation on December 26th.
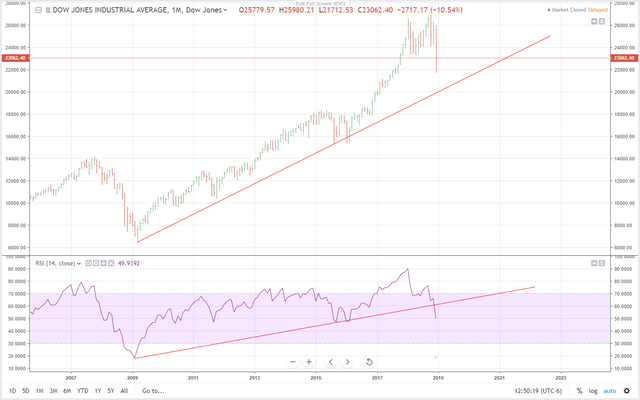
Take a look at the chart. keep in mind as you look at this chart and read this post that I'm not giving you financial advice. This is all for informational purposes and that this entire post is my thoughts and it is 100% my intellectual property. So, If you need trading or investment advise I would point you toward a directory of professionals in those fields. Moving on...there exist a deviation between the trend of the DJIA and the direction of the Relative Strength Index (RSI).
The market trend line begins at the March, 2009, bottom and never substantially deviates from the line and at the present the market hovers approximately 1,800+/- points above the line. Below that chart is the RSI. The trendline extends from the March, 2009, bottom to the March, 2015, bottom and then up. But for January-February, 2016's slight dip below the line the RSI never breaks below it. EXCEPT...between November and December of this year the RSI breached the line and shows an articulated deviation from the price chart trend. If the DJIA falls to the trend line I believe Wall Street is looking at a 3,000+/- point drop from Friday's close. I'm not saying that it will drop that much at oe time. please read further. If the market drops further and goes below the line then the August, 2016, high could be a market pit stop.
Anyways, that's my take on the market for at least the next 3-4 months IF the February, 2018 support line isn't overcame and there is a mad rush back to the ATH set in October. Of course, that would all be fueled by the U.S. Government and The FED. Pure manipulation. Do your research. Other than corporate buy backs and pension funds there is no one else buying in to this bubble. Even the CEO's are selling out.
In closing, I must bring your attention to 2 MAJOR factors looming in the Month of March, 2019:
This boom market the U.S. has seen since the Great Recession ended (allegedly, lol) in March 6, 2009, can only last so long. If you check U.S.'s history of economic cycles you'll see that the LONGEST period is ten years and zero months. That's looking back to circa 1846. If you add the 10 years, 0.00 months to March 6, 2009, we arrive at March 6, 2009. Think about it. Nothing last forever!
The United Kingdom is due to leave the European Union on March 29, 2019, at 11 p.m. (UK time). https://en.wikipedia.org/wiki/Brexit
As the saying goes, "Pray for peace but prepare for war". Please position yourself accordingly.
HAPPY NEW YEARS!!!!!
I think it's a moment of attention to a possible reversal.
Posted using Partiko iOS
Thank you for using Resteem & Voting Bot @allaz Your post will be min. 10+ resteemed with over 13000+ followers & min. 25+ Upvote Different account (5000+ Steem Power).