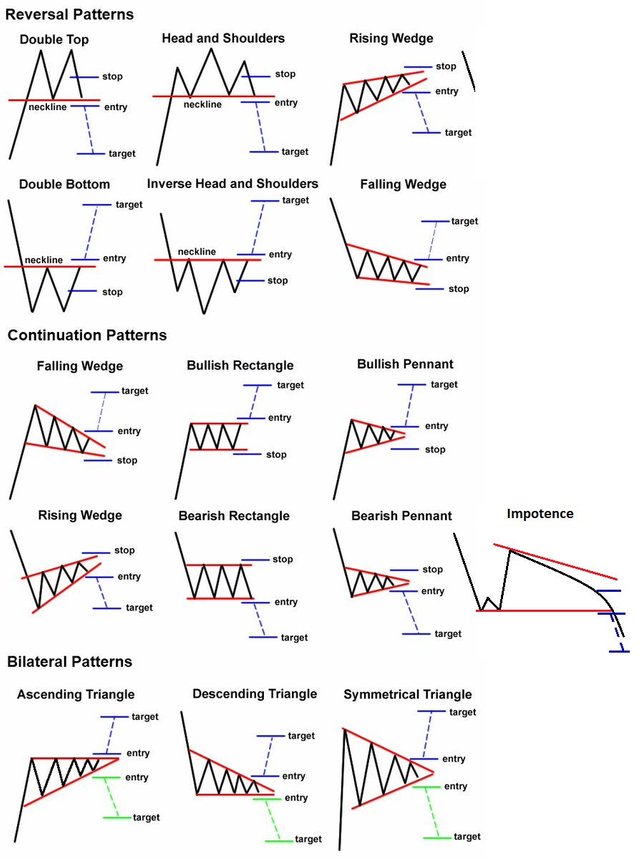
BlockchainTrade.Market™ - Recognizing Chart Patterns
Chart patterns have an established definition and criteria, but there are no patterns that tell you with 100% certainty where a security is headed. After all, the richest man in the world would be a trader in that case rather than an investor! The process of identifying chart patterns based on these criteria can be subjective in nature, which is why charting is often seen as more of an art than a science. (For more insight, see Is finance an art or science?).
The two most popular chart patterns are reversals and continuations. A reversal pattern signals that a prior trend will reverse upon completion of the pattern, while a continuation pattern signals that the trend will continue once the pattern is complete. These patterns can be found across any timeframe. In this section, we will review some of the more popular chart patterns. (To learn more, check out Continuation Patterns – Part 1, Part 2, Part 3, and Part 4).
Read more: Technical Analysis: Chart Patterns http://www.investopedia.com/university/technical/techanalysis8.asp#ixzz4vaLu5uWc
